• 文献检索
  • 文档翻译
  • 深度研究
  • 学术资讯
  • Suppr Zotero 插件Zotero 插件
  • 邀请有礼
  • 套餐&价格
  • 历史记录
应用&插件
Suppr Zotero 插件Zotero 插件浏览器插件Mac 客户端Windows 客户端微信小程序
定价
高级版会员购买积分包购买API积分包
服务
文献检索文档翻译深度研究API 文档MCP 服务
关于我们
关于 Suppr公司介绍联系我们用户协议隐私条款
关注我们

Suppr 超能文献

核心技术专利:CN118964589B侵权必究
粤ICP备2023148730 号-1Suppr @ 2026

文献检索

告别复杂PubMed语法,用中文像聊天一样搜索,搜遍4000万医学文献。AI智能推荐,让科研检索更轻松。

立即免费搜索

文件翻译

保留排版,准确专业,支持PDF/Word/PPT等文件格式,支持 12+语言互译。

免费翻译文档

深度研究

AI帮你快速写综述,25分钟生成高质量综述,智能提取关键信息,辅助科研写作。

立即免费体验

EHDViz:使用开源技术进行临床仪表板开发。

EHDViz: clinical dashboard development using open-source technologies.

作者信息

Badgeley Marcus A, Shameer Khader, Glicksberg Benjamin S, Tomlinson Max S, Levin Matthew A, McCormick Patrick J, Kasarskis Andrew, Reich David L, Dudley Joel T

机构信息

Harris Center for Precision Wellness, Icahn School of Medicine at Mount Sinai, Mount Sinai Health System, New York City, New York, USA Department of Genetics and Genomic Sciences, Icahn Institute for Genomics and Multiscale Biology, Icahn School of Medicine at Mount Sinai, Mount Sinai Health System, New York City, New York, USA.

Department of Genetics and Genomic Sciences, Icahn Institute for Genomics and Multiscale Biology, Icahn School of Medicine at Mount Sinai, Mount Sinai Health System, New York City, New York, USA Department of Anesthesiology, Icahn School of Medicine at Mount Sinai, Mount Sinai Health System, New York City, New York, USA.

出版信息

BMJ Open. 2016 Mar 24;6(3):e010579. doi: 10.1136/bmjopen-2015-010579.

DOI:10.1136/bmjopen-2015-010579
PMID:27013597
原文链接:https://pmc.ncbi.nlm.nih.gov/articles/PMC4809078/
Abstract

OBJECTIVE

To design, develop and prototype clinical dashboards to integrate high-frequency health and wellness data streams using interactive and real-time data visualisation and analytics modalities.

MATERIALS AND METHODS

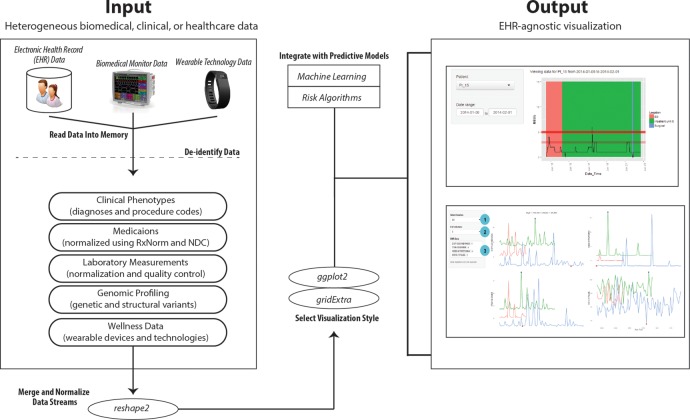
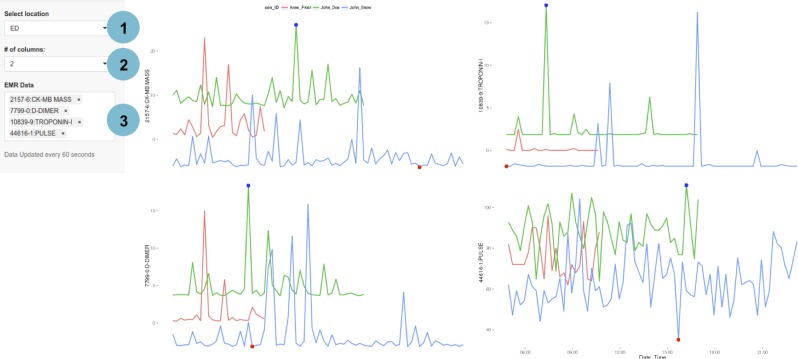
We developed a clinical dashboard development framework called electronic healthcare data visualization (EHDViz) toolkit for generating web-based, real-time clinical dashboards for visualising heterogeneous biomedical, healthcare and wellness data. The EHDViz is an extensible toolkit that uses R packages for data management, normalisation and producing high-quality visualisations over the web using R/Shiny web server architecture. We have developed use cases to illustrate utility of EHDViz in different scenarios of clinical and wellness setting as a visualisation aid for improving healthcare delivery.

RESULTS

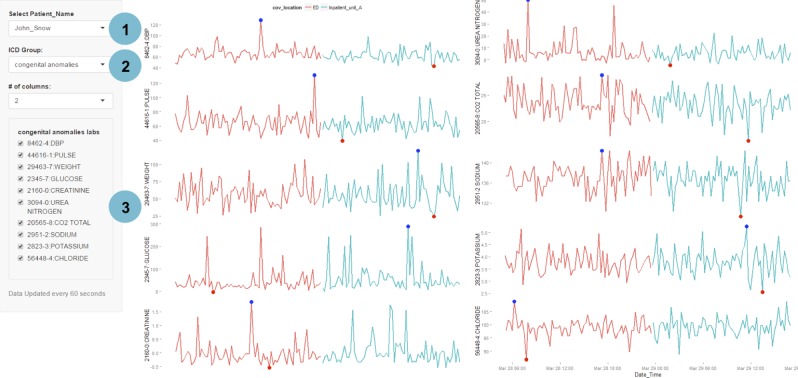
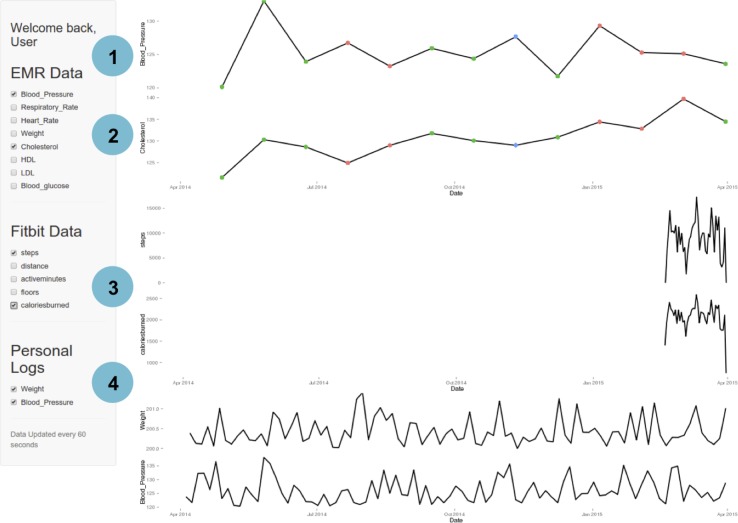
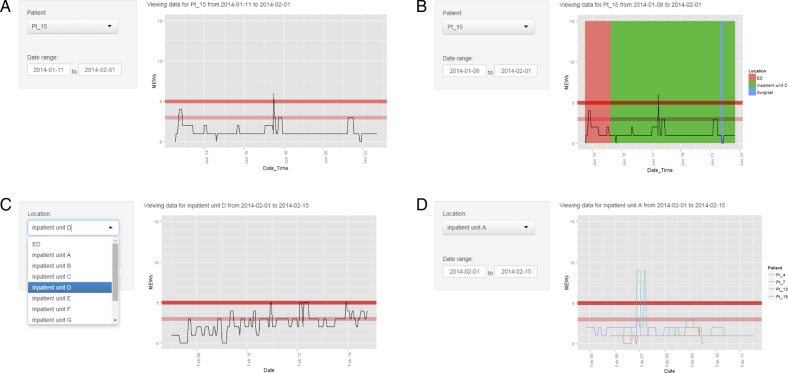
Using EHDViz, we prototyped clinical dashboards to demonstrate the contextual versatility of EHDViz toolkit. An outpatient cohort was used to visualise population health management tasks (n=14,221), and an inpatient cohort was used to visualise real-time acuity risk in a clinical unit (n=445), and a quantified-self example using wellness data from a fitness activity monitor worn by a single individual was also discussed (n-of-1). The back-end system retrieves relevant data from data source, populates the main panel of the application and integrates user-defined data features in real-time and renders output using modern web browsers. The visualisation elements can be customised using health features, disease names, procedure names or medical codes to populate the visualisations. The source code of EHDViz and various prototypes developed using EHDViz are available in the public domain at http://ehdviz.dudleylab.org.

CONCLUSIONS

Collaborative data visualisations, wellness trend predictions, risk estimation, proactive acuity status monitoring and knowledge of complex disease indicators are essential components of implementing data-driven precision medicine. As an open-source visualisation framework capable of integrating health assessment, EHDViz aims to be a valuable toolkit for rapid design, development and implementation of scalable clinical data visualisation dashboards.

摘要

目的

设计、开发并制作临床仪表盘原型,以使用交互式实时数据可视化和分析模式整合高频健康与保健数据流。

材料与方法

我们开发了一个名为电子医疗数据可视化(EHDViz)工具包的临床仪表盘开发框架,用于生成基于网络的实时临床仪表盘,以可视化异构生物医学、医疗保健和健康数据。EHDViz是一个可扩展的工具包,它使用R包进行数据管理、规范化,并使用R/Shiny网络服务器架构在网络上生成高质量可视化效果。我们开发了用例,以说明EHDViz在临床和健康环境的不同场景中作为改善医疗服务可视化辅助工具的效用。

结果

使用EHDViz,我们制作了临床仪表盘原型,以展示EHDViz工具包在不同场景中的通用性。一个门诊队列用于可视化人群健康管理任务(n = 14221),一个住院队列用于可视化临床科室的实时急性风险(n = 445),还讨论了一个使用单个人佩戴的健身活动监测器的健康数据的个体量化自我示例(n-of-1)。后端系统从数据源检索相关数据,填充应用程序的主面板,并实时集成用户定义的数据特征,然后使用现代网络浏览器呈现输出。可视化元素可以使用健康特征、疾病名称、手术名称或医学代码进行定制,以填充可视化内容。EHDViz的源代码以及使用EHDViz开发的各种原型可在http://ehdviz.dudleylab.org的公共领域获取。

结论

协作式数据可视化、健康趋势预测、风险估计、主动急性状态监测以及对复杂疾病指标的了解是实施数据驱动的精准医学的重要组成部分。作为一个能够整合健康评估的开源可视化框架,EHDViz旨在成为快速设计、开发和实施可扩展临床数据可视化仪表盘的有价值工具包。

https://cdn.ncbi.nlm.nih.gov/pmc/blobs/dfc7/4809078/b1f55f9087de/bmjopen2015010579f05.jpg
https://cdn.ncbi.nlm.nih.gov/pmc/blobs/dfc7/4809078/6873473e506c/bmjopen2015010579f01.jpg
https://cdn.ncbi.nlm.nih.gov/pmc/blobs/dfc7/4809078/505a0d343ba9/bmjopen2015010579f02.jpg
https://cdn.ncbi.nlm.nih.gov/pmc/blobs/dfc7/4809078/56c0c78a09a7/bmjopen2015010579f03.jpg
https://cdn.ncbi.nlm.nih.gov/pmc/blobs/dfc7/4809078/c6db4a6f64bd/bmjopen2015010579f04.jpg
https://cdn.ncbi.nlm.nih.gov/pmc/blobs/dfc7/4809078/b1f55f9087de/bmjopen2015010579f05.jpg

相似文献

1
EHDViz: clinical dashboard development using open-source technologies.EHDViz:使用开源技术进行临床仪表板开发。
BMJ Open. 2016 Mar 24;6(3):e010579. doi: 10.1136/bmjopen-2015-010579.
2
Developing an Intranet-Based Lymphedema Dashboard for Breast Cancer Multidisciplinary Teams: Design Research Study.为乳腺癌多学科团队开发基于内联网的淋巴水肿信息平台:设计研究
J Med Internet Res. 2020 Apr 21;22(4):e13188. doi: 10.2196/13188.
3
Digital Health Dashboards for Decision-Making to Enable Rapid Responses During Public Health Crises: Replicable and Scalable Methodology.用于决策的数字健康仪表盘,以在公共卫生危机期间实现快速响应:可复制和可扩展的方法。
JMIR Res Protoc. 2023 Jun 30;12:e46810. doi: 10.2196/46810.
4
From Information Management to Information Visualization: Development of Radiology Dashboards.从信息管理到信息可视化:放射学仪表板的发展
Appl Clin Inform. 2016 May 11;7(2):308-29. doi: 10.4338/ACI-2015-08-RA-0104. eCollection 2016.
5
Developing a Data Dashboard Framework for Population Health Surveillance: Widening Access to Clinical Trial Findings.开发用于人群健康监测的数据仪表板框架:扩大对临床试验结果的获取。
JMIR Form Res. 2019 Apr 4;3(2):e11342. doi: 10.2196/11342.
6
Protocol for developing a dashboard for interactive cohort analysis of oral health-related data.用于交互式队列分析口腔健康相关数据的仪表板开发方案。
BMC Oral Health. 2023 Apr 24;23(1):238. doi: 10.1186/s12903-023-02895-2.
7
Web-Based Dashboard for the Interactive Visualization and Analysis of National Risk-Standardized Mortality Rates of Sepsis in the US.基于网络的美国脓毒症国家风险标准化死亡率交互式可视化和分析仪表板。
J Med Syst. 2020 Jan 11;44(2):54. doi: 10.1007/s10916-019-1509-9.
8
Exploring Changes to the Actionability of COVID-19 Dashboards Over the Course of 2020 in the Canadian Context: Descriptive Assessment and Expert Appraisal Study.探索2020年期间加拿大背景下新冠疫情仪表盘可操作性的变化:描述性评估与专家评估研究
J Med Internet Res. 2021 Aug 6;23(8):e30200. doi: 10.2196/30200.
9
A web-based multidisciplinary team meeting visualisation system.基于网络的多学科团队会议可视化系统。
Int J Comput Assist Radiol Surg. 2019 Dec;14(12):2221-2231. doi: 10.1007/s11548-019-01999-x. Epub 2019 May 21.
10
Deploying geospatial visualization dashboards to combat the socioeconomic impacts of COVID-19.部署地理空间可视化仪表板以应对新冠疫情的社会经济影响。
Environ Plan B Urban Anal City Sci. 2023 Jun;50(5):1262-1279. doi: 10.1177/23998083221142863. Epub 2022 Dec 7.

引用本文的文献

1
Automate, Illuminate, Predict: A Universal Framework for Integrating Wearable Sensors in Healthcare.自动化、智能化、预测化:一种将可穿戴传感器集成到医疗保健中的通用框架。
Digit Biomark. 2024 Aug 26;8(1):149-158. doi: 10.1159/000540492. eCollection 2024 Jan-Dec.
2
Introducing Attribute Association Graphs to Facilitate Medical Data Exploration: Development and Evaluation Using Epidemiological Study Data.引入属性关联图以促进医学数据探索:使用流行病学研究数据进行开发与评估
JMIR Med Inform. 2024 Jul 24;12:e49865. doi: 10.2196/49865.
3
Alerts and Collections for Automating Patients' Sensemaking and Organizing of Their Electronic Health Record Data for Reflection, Planning, and Clinical Visits: Qualitative Research-Through-Design Study.

本文引用的文献

1
Big Data and Predictive Analytics in Health Care.大数据与医疗保健预测分析。
Big Data. 2014 Sep;2(3):113-6. doi: 10.1089/big.2014.1525.
2
The Quantified Self: Fundamental Disruption in Big Data Science and Biological Discovery.量化自我:大数据科学和生物发现的根本性颠覆
Big Data. 2013 Jun;1(2):85-99. doi: 10.1089/big.2012.0002.
3
Translational bioinformatics in the era of real-time biomedical, health care and wellness data streams.实时生物医学、医疗保健与健康数据流时代的转化生物信息学。
用于自动促进患者对其电子健康记录数据进行意义建构、整理以便反思、规划和临床就诊的警报与信息收集:定性设计研究。
JMIR Hum Factors. 2023 Aug 21;10:e41552. doi: 10.2196/41552.
4
Accommodating Serial Correlation and Sequential Design Elements in Personalized Studies and Aggregated Personalized Studies.在个性化研究和汇总个性化研究中考虑序列相关性和序贯设计元素。
Harv Data Sci Rev. 2022;2022(SI3). doi: 10.1162/99608f92.f1eef6f4. Epub 2022 Sep 8.
5
Situation Awareness-Oriented Dashboard in ICUs in Support of Resource Management in Time of Pandemics.面向 ICU 资源管理的态势感知仪表盘在大流行期间的支持。
IEEE J Transl Eng Health Med. 2023 Jan 31;11:151-160. doi: 10.1109/JTEHM.2023.3241215. eCollection 2023.
6
Analytical exploratory tool for healthcare professionals to monitor cancer patients' progress.供医疗保健专业人员监测癌症患者病情进展的分析性探索工具。
Front Oncol. 2023 Jan 9;12:1043411. doi: 10.3389/fonc.2022.1043411. eCollection 2022.
7
StarGazer: A Hybrid Intelligence Platform for Drug Target Prioritization and Digital Drug Repositioning Using Streamlit.星象仪:一个使用Streamlit进行药物靶点优先级排序和数字药物重新定位的混合智能平台。
Front Genet. 2022 May 31;13:868015. doi: 10.3389/fgene.2022.868015. eCollection 2022.
8
Consumer-grade wearables identify changes in multiple physiological systems during COVID-19 disease progression.消费级可穿戴设备可识别 COVID-19 疾病进展过程中多个生理系统的变化。
Cell Rep Med. 2022 Apr 19;3(4):100601. doi: 10.1016/j.xcrm.2022.100601.
9
OSPred Tool: A Digital Health Aid for Rapid Predictive Analysis of Correlations Between Early End Points and Overall Survival in Non-Small-Cell Lung Cancer Clinical Trials.OSPred 工具:一种数字健康辅助工具,用于快速预测分析非小细胞肺癌临床试验中早期终点与总生存期之间的相关性。
JCO Clin Cancer Inform. 2022 Mar;6:e2100173. doi: 10.1200/CCI.21.00173.
10
CONSENSUS: a Shiny application of dementia evaluation and reporting for the KU ADC longitudinal Clinical Cohort database.共识:用于堪萨斯大学阿尔茨海默病研究中心纵向临床队列数据库的痴呆评估与报告的一个Shiny应用程序。
JAMIA Open. 2021 Aug 2;4(3):ooab060. doi: 10.1093/jamiaopen/ooab060. eCollection 2021 Jul.
Brief Bioinform. 2017 Jan;18(1):105-124. doi: 10.1093/bib/bbv118. Epub 2016 Feb 14.
4
Design of a randomized controlled trial of disclosing genomic risk of coronary heart disease: the Myocardial Infarction Genes (MI-GENES) study.冠心病基因组风险披露的随机对照试验设计:心肌梗死基因(MI-GENES)研究
BMC Med Genomics. 2015 Aug 15;8:51. doi: 10.1186/s12920-015-0122-0.
5
Mobile health-care information for all: a global challenge.全民移动医疗信息:一项全球挑战。
Lancet Glob Health. 2015 Jul;3(7):e356-7. doi: 10.1016/S2214-109X(15)00054-6.
6
What you need to know to make the most of big data in biology.充分利用生物学大数据所需了解的内容。
Lancet. 2015 Feb 26;385 Suppl 1:S5-6. doi: 10.1016/S0140-6736(15)60321-X.
7
The effect of patient portals on quality outcomes and its implications to meaningful use: a systematic review.患者门户对质量结果的影响及其对有意义使用的启示:一项系统综述。
J Med Internet Res. 2015 Feb 10;17(2):e44. doi: 10.2196/jmir.3171.
8
Automated detection of physiologic deterioration in hospitalized patients.住院患者生理功能恶化的自动检测
J Am Med Inform Assoc. 2015 Mar;22(2):350-60. doi: 10.1136/amiajnl-2014-002816. Epub 2014 Aug 27.
9
Visualizing unstructured patient data for assessing diagnostic and therapeutic history.可视化非结构化患者数据以评估诊断和治疗史。
Stud Health Technol Inform. 2014;205:1158-62.
10
Multicenter development and validation of a risk stratification tool for ward patients.多中心开发和验证一种用于病房患者的风险分层工具。
Am J Respir Crit Care Med. 2014 Sep 15;190(6):649-55. doi: 10.1164/rccm.201406-1022OC.