Patel Mitesh S, Volpp Kevin G, Rosin Roy, Bellamy Scarlett L, Small Dylan S, Fletcher Michele A, Osman-Koss Rosemary, Brady Jennifer L, Haff Nancy, Lee Samantha M, Wesby Lisa, Hoffer Karen, Shuttleworth David, Taylor Devon H, Hilbert Victoria, Zhu Jingsan, Yang Lin, Wang Xingmei, Asch David A
Perelman School of Medicine, University of Pennsylvania, Philadelphia, PA, USA Wharton School, University of Pennsylvania, Philadelphia, PA, USA LDI Center for Health Incentives and Behavioral Economics, University of Pennsylvania, Philadelphia, PA, USA Center for Health Care Innovation, University of Pennsylvania Health System, Philadelphia, PA, USA Center for Health Equity Research and Promotion, Crescenz Veterans Affairs Medical Center, Philadelphia, PA, USA
Perelman School of Medicine, University of Pennsylvania, Philadelphia, PA, USA Wharton School, University of Pennsylvania, Philadelphia, PA, USA LDI Center for Health Incentives and Behavioral Economics, University of Pennsylvania, Philadelphia, PA, USA Center for Health Care Innovation, University of Pennsylvania Health System, Philadelphia, PA, USA Center for Health Equity Research and Promotion, Crescenz Veterans Affairs Medical Center, Philadelphia, PA, USA.
Am J Health Promot. 2016 Jul;30(6):416-24. doi: 10.1177/0890117116658195. Epub 2016 Jul 15.
To compare the effectiveness of different combinations of social comparison feedback and financial incentives to increase physical activity.
Randomized trial (Clinicaltrials.gov number, NCT02030080).
Philadelphia, Pennsylvania.
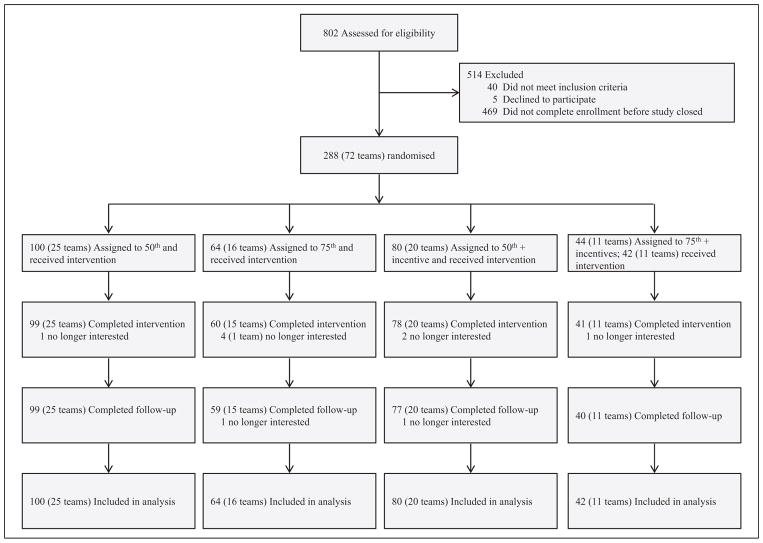
Two hundred eighty-six adults.
Twenty-six weeks of weekly feedback on team performance compared to the 50th percentile (n = 100) or the 75th percentile (n = 64) and 13 weeks of weekly lottery-based financial incentive plus feedback on team performance compared to the 50th percentile (n = 80) or the 75th percentile (n = 44) followed by 13 weeks of only performance feedback.
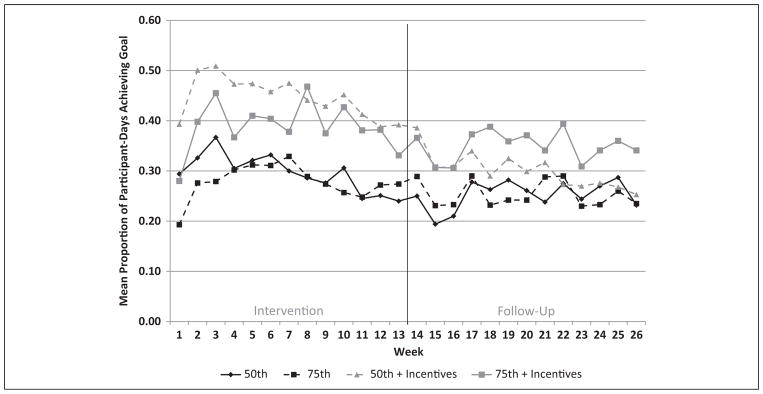
Mean proportion of participant-days achieving the 7000-step goal during the 13-week intervention.
Generalized linear mixed models adjusting for repeated measures and clustering by team.
Compared to the 75th percentile without incentives during the intervention period, the mean proportion achieving the 7000-step goal was significantly greater for the 50th percentile with incentives group (0.45 vs 0.27, difference: 0.18, 95% confidence interval [CI]: 0.04 to 0.32; P = .012) but not for the 75th percentile with incentives group (0.38 vs 0.27, difference: 0.11, 95% CI: -0.05 to 0.27; P = .19) or the 50th percentile without incentives group (0.30 vs 0.27, difference: 0.03, 95% CI: -0.10 to 0.16; P = .67).
Social comparison to the 50th percentile with financial incentives was most effective for increasing physical activity.
比较社会比较反馈与经济激励的不同组合对增加身体活动的有效性。
随机试验(Clinicaltrials.gov编号,NCT02030080)。
宾夕法尼亚州费城。
286名成年人。
26周每周提供团队表现与第50百分位数(n = 100)或第75百分位数(n = 64)比较的反馈,以及13周每周基于抽奖的经济激励加上团队表现与第50百分位数(n = 80)或第75百分位数(n = 44)比较的反馈,随后是13周仅提供表现反馈。
在13周干预期间达到7000步目标的参与者天数的平均比例。
采用广义线性混合模型,对重复测量和团队聚类进行调整。
与干预期间无激励的第75百分位数组相比,有激励的第50百分位数组达到7000步目标的平均比例显著更高(0.45对0.27,差值:0.18,95%置信区间[CI]:0.04至0.32;P = 0.012),但有激励的第75百分位数组(0.38对0.27,差值:0.11,95%CI:-0.05至0.27;P = 0.19)或无激励的第50百分位数组(0.30对0.27,差值:0.03,95%CI:-0.10至0.16;P = 0.67)并非如此。
与第50百分位数进行社会比较并给予经济激励对增加身体活动最为有效。