Gratzl S, Lex A, Gehlenborg N, Cosgrove N, Streit M
Johannes Kepler University Linz, Austria.
University of Utah, United States of America.
Comput Graph Forum. 2016 Jun;35(3):491-500. doi: 10.1111/cgf.12925. Epub 2016 Jul 4.
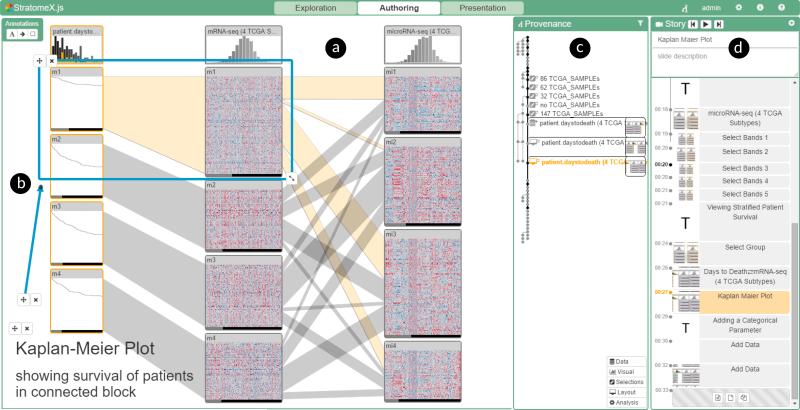
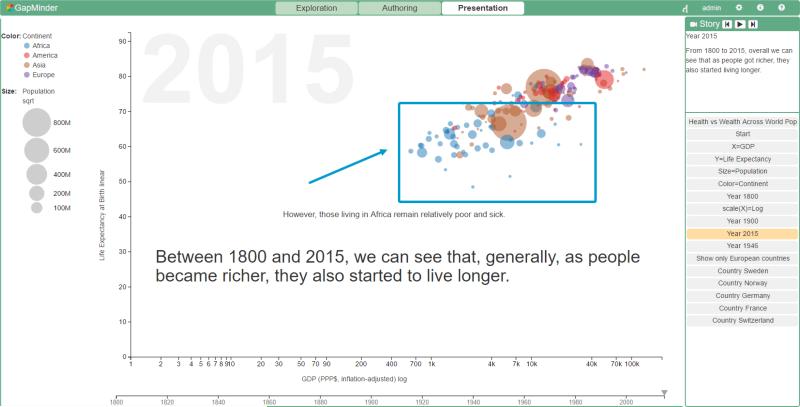
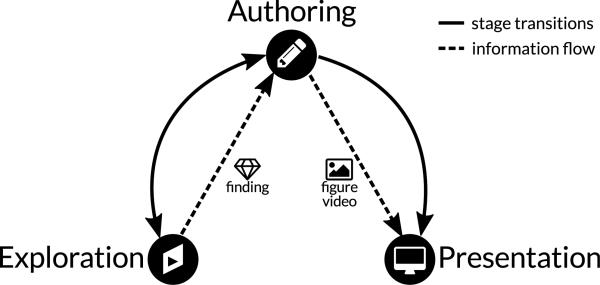
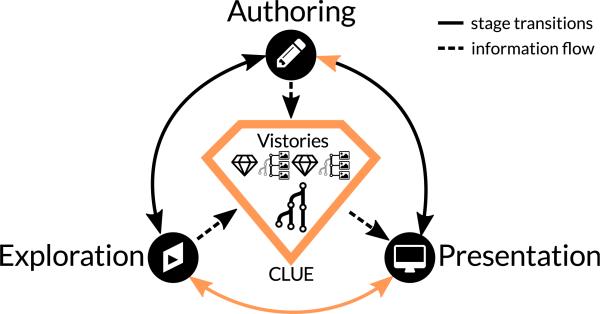
The primary goal of visual data exploration tools is to enable the discovery of new insights. To justify and reproduce insights, the discovery process needs to be documented and communicated. A common approach to documenting and presenting findings is to capture visualizations as images or videos. Images, however, are insufficient for telling the story of a visual discovery, as they lack full provenance information and context. Videos are difficult to produce and edit, particularly due to the non-linear nature of the exploratory process. Most importantly, however, neither approach provides the opportunity to return to any point in the exploration in order to review the state of the visualization in detail or to conduct additional analyses. In this paper we present CLUE (Capture, Label, Understand, Explain), a model that tightly integrates data exploration and presentation of discoveries. Based on provenance data captured during the exploration process, users can extract key steps, add annotations, and author "Vistories", visual stories based on the history of the exploration. These Vistories can be shared for others to view, but also to retrace and extend the original analysis. We discuss how the CLUE approach can be integrated into visualization tools and provide a prototype implementation. Finally, we demonstrate the general applicability of the model in two usage scenarios: a Gapminder-inspired visualization to explore public health data and an example from molecular biology that illustrates how Vistories could be used in scientific journals. (see Figure 1 for visual abstract).
视觉数据探索工具的主要目标是实现新见解的发现。为了证明和重现这些见解,发现过程需要被记录和传达。记录和展示发现的一种常见方法是将可视化内容捕获为图像或视频。然而,图像对于讲述视觉发现的过程来说是不够的,因为它们缺乏完整的出处信息和上下文。视频制作和编辑都很困难,尤其是考虑到探索过程的非线性特性。然而,最重要的是,这两种方法都没有提供返回探索过程中任何一点的机会,以便详细审查可视化的状态或进行额外的分析。在本文中,我们提出了CLUE(捕获、标记、理解、解释),这是一种将数据探索与发现展示紧密集成的模型。基于探索过程中捕获的出处数据,用户可以提取关键步骤、添加注释,并创作“可视化历程”,即基于探索历史的视觉故事。这些可视化历程不仅可以共享供他人查看,还能让人追溯和扩展原始分析。我们讨论了如何将CLUE方法集成到可视化工具中,并提供了一个原型实现。最后,我们在两个使用场景中展示了该模型的普遍适用性:一个受Gapminder启发的用于探索公共卫生数据的可视化,以及一个来自分子生物学的例子,说明了可视化历程如何在科学期刊中使用。(可视化摘要见图1)