Montesinos-López Osval A, Montesinos-López Abelardo, Crossa José, de Los Campos Gustavo, Alvarado Gregorio, Suchismita Mondal, Rutkoski Jessica, González-Pérez Lorena, Burgueño Juan
International Maize and Wheat Improvement Center (CIMMYT), Apdo. Postal 6-641, 06600 Mexico City, Mexico ; Facultad de Telemática, Universidad de Colima, 28040 Colima, Colima Mexico.
Departamento de Estadística, Centro de Investigación en Matemáticas (CIMAT), 36240 Guanajuato, Guanajuato Mexico.
Plant Methods. 2017 Jan 3;13:4. doi: 10.1186/s13007-016-0154-2. eCollection 2017.
Modern agriculture uses hyperspectral cameras to obtain hundreds of reflectance data measured at discrete narrow bands to cover the whole visible light spectrum and part of the infrared and ultraviolet light spectra, depending on the camera. This information is used to construct vegetation indices (VI) (e.g., green normalized difference vegetation index or GNDVI, simple ratio or SRa, etc.) which are used for the prediction of primary traits (e.g., biomass). However, these indices only use some bands and are cultivar-specific; therefore they lose considerable information and are not robust for all cultivars.
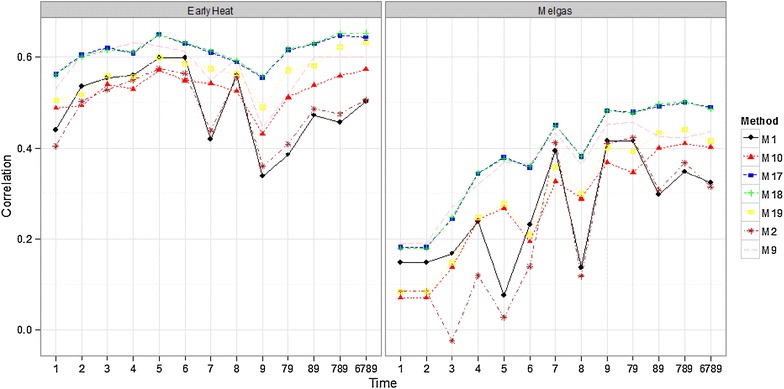
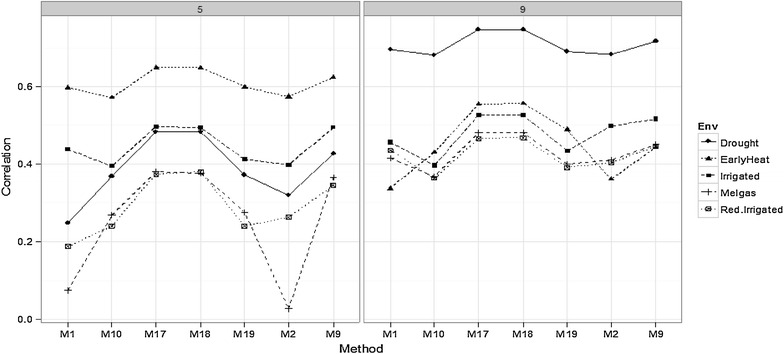
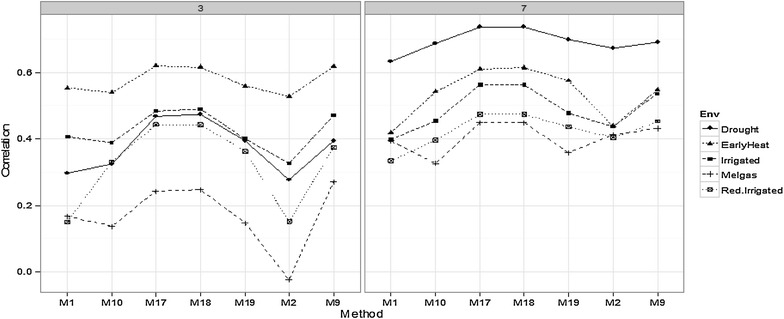
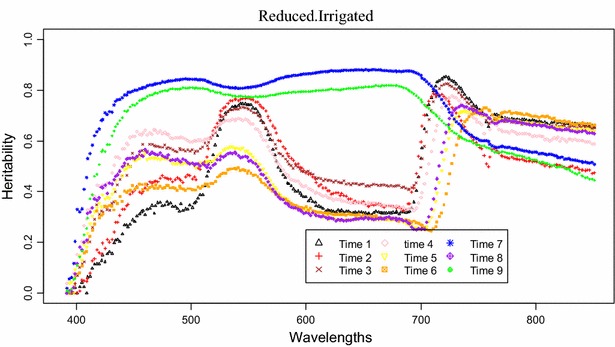
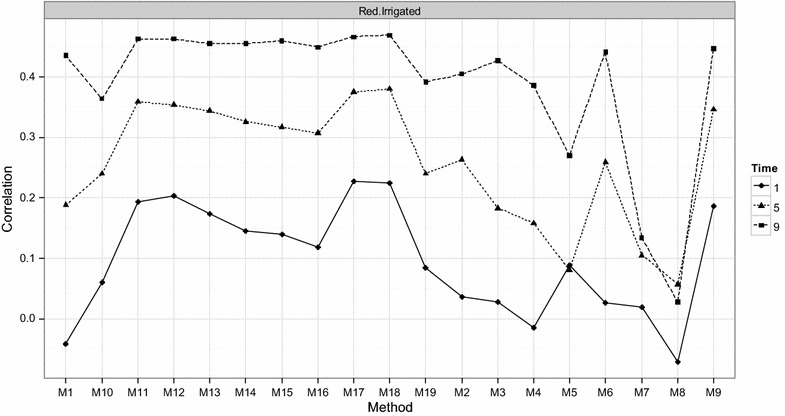
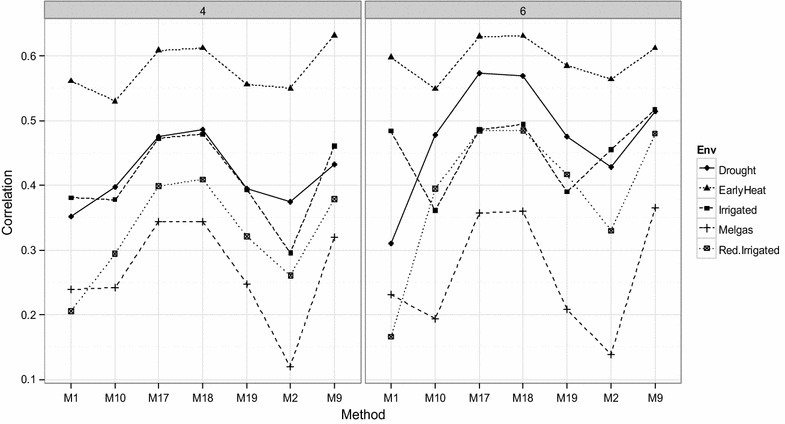
This study proposes models that use all available bands as predictors to increase prediction accuracy; we compared these approaches with eight conventional vegetation indexes (VIs) constructed using only some bands. The data set we used comes from CIMMYT's global wheat program and comprises 1170 genotypes evaluated for grain yield (ton/ha) in five environments (Drought, Irrigated, EarlyHeat, Melgas and Reduced Irrigated); the reflectance data were measured in 250 discrete narrow bands ranging between 392 and 851 nm. The proposed models for the simultaneous analysis of all the bands were ordinal least square (OLS), Bayes B, principal components with Bayes B, functional B-spline, functional Fourier and functional partial least square. The results of these models were compared with the OLS performed using as predictors each of the eight VIs individually and combined.
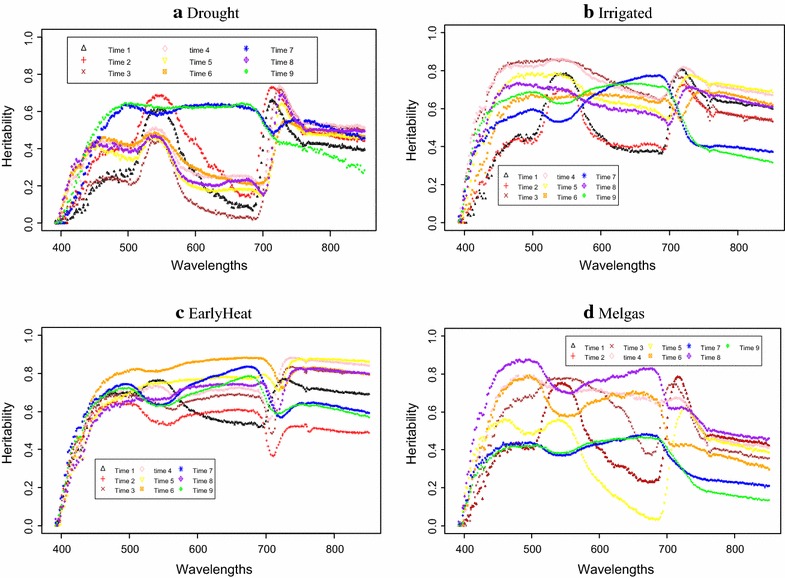
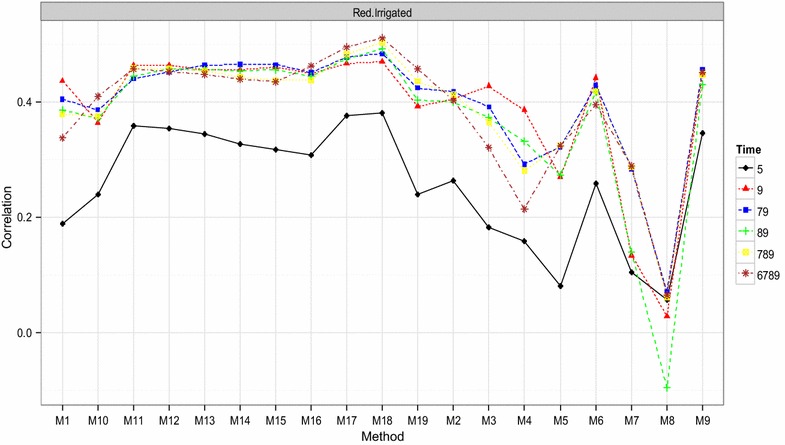
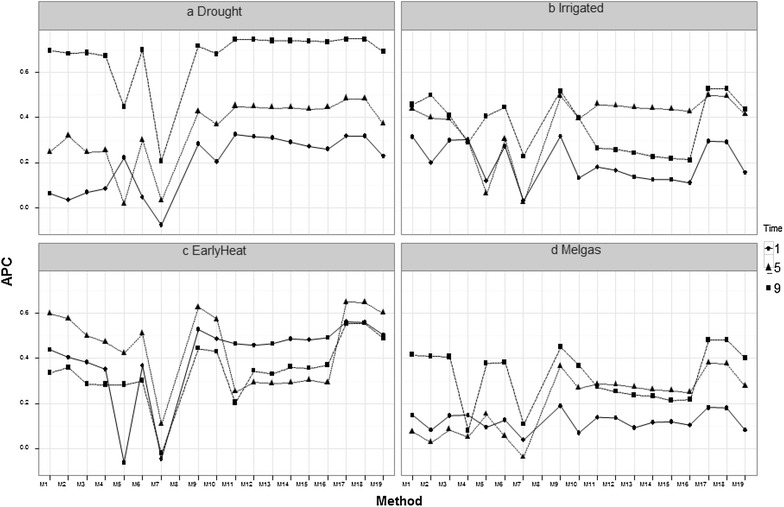
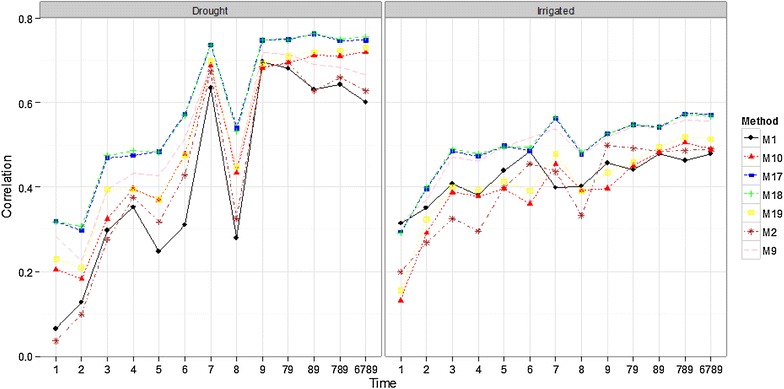
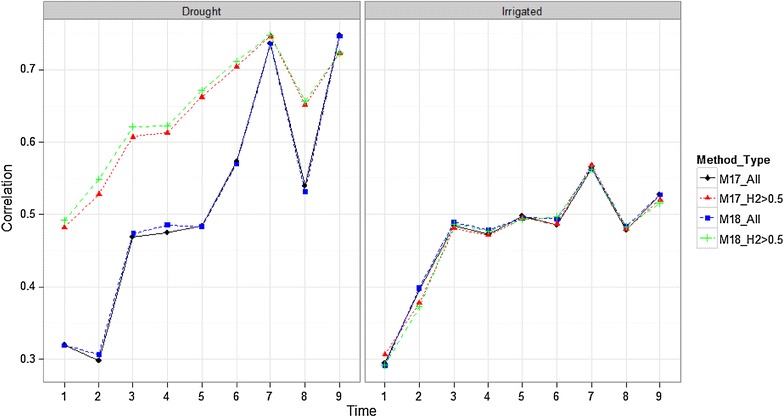
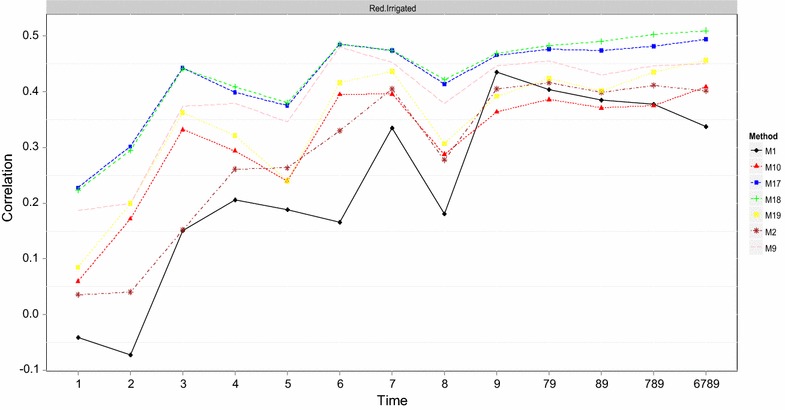
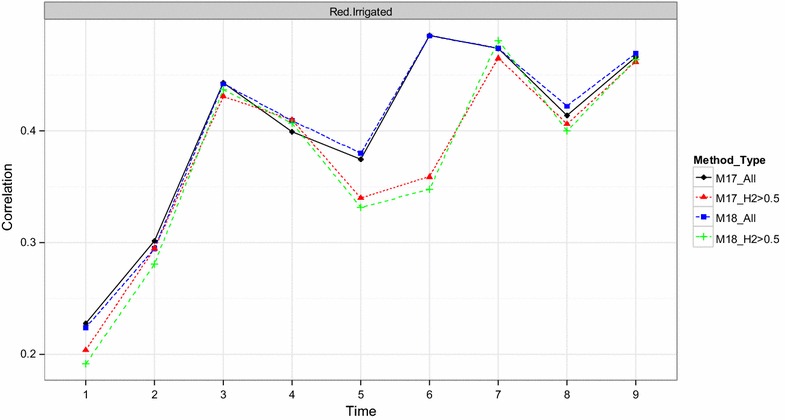
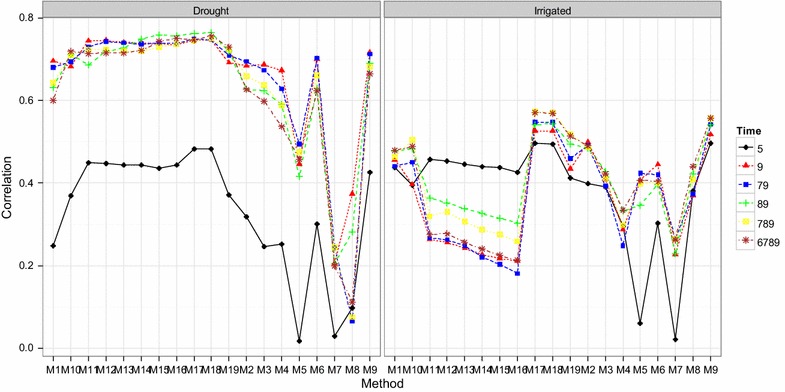
We found that using all bands simultaneously increased prediction accuracy more than using VI alone. The Splines and Fourier models had the best prediction accuracy for each of the nine time-points under study. Combining image data collected at different time-points led to a small increase in prediction accuracy relative to models that use data from a single time-point. Also, using bands with heritabilities larger than 0.5 only in Drought as predictor variables showed improvements in prediction accuracy.
现代农业使用高光谱相机获取数百个在离散窄波段测量的反射率数据,以覆盖整个可见光谱以及部分红外和紫外光谱,具体取决于相机。这些信息用于构建植被指数(VI)(例如,绿色归一化差异植被指数或GNDVI、简单比值或SRa等),这些指数用于预测主要性状(例如生物量)。然而,这些指数仅使用了一些波段,并且具有品种特异性;因此,它们丢失了大量信息,并且对所有品种而言并不稳健。
本研究提出了使用所有可用波段作为预测因子的模型,以提高预测准确性;我们将这些方法与仅使用一些波段构建的八个传统植被指数(VIs)进行了比较。我们使用的数据集来自国际玉米小麦改良中心(CIMMYT)的全球小麦项目,包括在五个环境(干旱、灌溉、早热、梅尔加斯和减灌)中评估的1170个基因型的谷物产量(吨/公顷);反射率数据在392至851纳米之间的250个离散窄波段进行测量。用于同时分析所有波段的模型有有序最小二乘法(OLS)、贝叶斯B、带贝叶斯B的主成分、函数B样条、函数傅里叶和函数偏最小二乘法。将这些模型的结果与分别单独使用八个VI中的每一个作为预测因子以及将它们组合使用时进行的OLS结果进行了比较。
我们发现,与单独使用VI相比,同时使用所有波段可提高预测准确性。样条和傅里叶模型在所研究的九个时间点中的每个时间点都具有最佳的预测准确性。相对于使用单个时间点数据的模型,组合在不同时间点收集的图像数据导致预测准确性略有提高。此外,仅在干旱环境中使用遗传力大于0.5的波段作为预测变量显示出预测准确性有所提高。