• 文献检索
  • 文档翻译
  • 深度研究
  • 学术资讯
  • Suppr Zotero 插件Zotero 插件
  • 邀请有礼
  • 套餐&价格
  • 历史记录
应用&插件
Suppr Zotero 插件Zotero 插件浏览器插件Mac 客户端Windows 客户端微信小程序
定价
高级版会员购买积分包购买API积分包
服务
文献检索文档翻译深度研究API 文档MCP 服务
关于我们
关于 Suppr公司介绍联系我们用户协议隐私条款
关注我们

Suppr 超能文献

核心技术专利:CN118964589B侵权必究
粤ICP备2023148730 号-1Suppr @ 2026

文献检索

告别复杂PubMed语法,用中文像聊天一样搜索,搜遍4000万医学文献。AI智能推荐,让科研检索更轻松。

立即免费搜索

文件翻译

保留排版,准确专业,支持PDF/Word/PPT等文件格式,支持 12+语言互译。

免费翻译文档

深度研究

AI帮你快速写综述,25分钟生成高质量综述,智能提取关键信息,辅助科研写作。

立即免费体验

2014年美国致命伤害的州级终身医疗和工作损失成本

State-Level Lifetime Medical and Work-Loss Costs of Fatal Injuries - United States, 2014.

作者信息

Luo Feijun, Florence Curtis

机构信息

Division of Analysis, Research and Practice Integration, National Center for Injury Prevention and Control, CDC.

出版信息

MMWR Morb Mortal Wkly Rep. 2017 Jan 13;66(1):1-11. doi: 10.15585/mmwr.mm6601a1.

DOI:10.15585/mmwr.mm6601a1
PMID:28081055
原文链接:https://pmc.ncbi.nlm.nih.gov/articles/PMC5687268/
Abstract

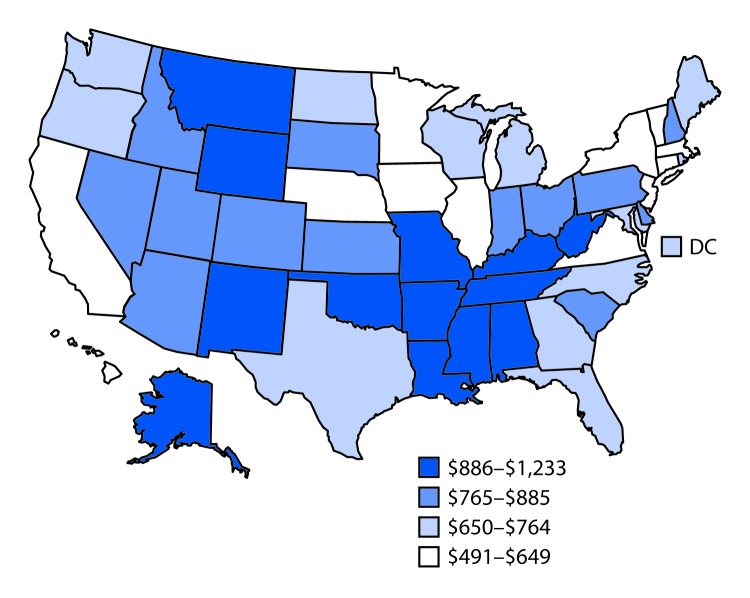
Injury-associated deaths have substantial economic consequences in the United States. The total estimated lifetime medical and work-loss costs associated with fatal injuries in 2013 were $214 billion (1). In 2014, unintentional injury, suicide, and homicide (the fourth, tenth, and seventeenth leading causes of death, respectively) accounted for 194,635 deaths in the United States (2). In 2014, a total of 199,756 fatal injuries occurred in the United States, and the associated lifetime medical and work-loss costs were $227 billion (3). This report examines the state-level economic burdens of fatal injuries by extending a previous national-level study (1). Numbers and rates of fatal injuries, lifetime costs, and lifetime costs per capita were calculated for each of the 50 states and the District of Columbia (DC) and for four injury intent categories (all intents, unintentional, suicide, and homicide). During 2014, injury mortality rates and economic burdens varied widely among the states and DC. Among fatal injuries of all intents, the mortality rate and lifetime costs per capita ranged from 101.9 per 100,000 and $1,233, respectively (New Mexico) to 40.2 per 100,000 and $491 (New York). States can engage more effectively and efficiently in injury prevention if they are aware of the economic burden of injuries, identify areas for immediate improvement, and devote necessary resources to those areas.

摘要

在美国,与伤害相关的死亡会带来巨大的经济后果。2013年,与致命伤害相关的终身医疗和工作损失成本估计总计达2140亿美元(1)。2014年,意外伤害、自杀和杀人(分别是第四、第十和第十七大死因)导致美国194,635人死亡(2)。2014年,美国共发生199,756起致命伤害事件,相关的终身医疗和工作损失成本为2270亿美元(3)。本报告通过扩展之前的一项国家级研究(1),审视了各州层面致命伤害的经济负担。计算了50个州和哥伦比亚特区(DC)以及四种伤害意图类别(所有意图、意外伤害、自杀和杀人)的致命伤害数量、发生率、终身成本和人均终身成本。2014年期间,各州和哥伦比亚特区的伤害死亡率和经济负担差异很大。在所有意图的致命伤害中,死亡率和人均终身成本从每10万人101.9例和1233美元(新墨西哥州)到每10万人40.2例和491美元(纽约州)不等。如果各州意识到伤害的经济负担,确定需要立即改进的领域,并为这些领域投入必要资源,就能更有效且高效地开展伤害预防工作。

https://cdn.ncbi.nlm.nih.gov/pmc/blobs/ef72/5687268/838e9d2056d5/mm6601a1-F.jpg

相似文献

1
State-Level Lifetime Medical and Work-Loss Costs of Fatal Injuries - United States, 2014.2014年美国致命伤害的州级终身医疗和工作损失成本
MMWR Morb Mortal Wkly Rep. 2017 Jan 13;66(1):1-11. doi: 10.15585/mmwr.mm6601a1.
2
Estimated Lifetime Medical and Work-Loss Costs of Fatal Injuries--United States, 2013.2013 年美国致命伤害的终生医疗和工作损失成本估算。
MMWR Morb Mortal Wkly Rep. 2015 Oct 2;64(38):1074-7. doi: 10.15585/mmwr.mm6438a4.
3
Estimated Lifetime Medical and Work-Loss Costs of Emergency Department-Treated Nonfatal Injuries--United States, 2013.2013 年美国急诊治疗非致命性损伤的预期终身医疗和工作损失成本。
MMWR Morb Mortal Wkly Rep. 2015 Oct 2;64(38):1078-82. doi: 10.15585/mmwr.mm6438a5.
4
Surveillance for Violent Deaths - National Violent Death Reporting System, 34 States, Four California Counties, the District of Columbia, and Puerto Rico, 2017.暴力死亡监测 - 国家暴力死亡报告系统,2017 年,34 个州、加利福尼亚州的 4 个县、哥伦比亚特区和波多黎各。
MMWR Surveill Summ. 2020 Dec 4;69(8):1-37. doi: 10.15585/mmwr.ss6908a1.
5
State-Level Economic Costs of Fatal Injuries - United States, 2019.2019 年美国致命伤害的州级经济成本。
MMWR Morb Mortal Wkly Rep. 2021 Dec 3;70(48):1660-1663. doi: 10.15585/mmwr.mm7048a2.
6
Surveillance for Violent Deaths - National Violent Death Reporting System, 17 States, 2013.暴力死亡监测 - 国家暴力死亡报告系统,17 个州,2013 年。
MMWR Surveill Summ. 2016 Aug 19;65(10):1-42. doi: 10.15585/mmwr.ss6510a1.
7
Surveillance for Violent Deaths -
National Violent Death Reporting System, 18 States, 2014.暴力死亡监测——国家暴力死亡报告系统,18 个州,2014 年。
MMWR Surveill Summ. 2018 Feb 2;67(2):1-36. doi: 10.15585/mmwr.ss6702a1.
8
Surveillance for Violent Deaths - National Violent Death Reporting System, 48 States, the District of Columbia, and Puerto Rico, 2020.暴力死亡监测 - 全国暴力死亡报告系统,2020 年,48 个州、哥伦比亚特区和波多黎各。
MMWR Surveill Summ. 2023 May 26;72(5):1-38. doi: 10.15585/mmwr.ss7205a1.
9
Surveillance for violent deaths - National Violent Death Reporting System, 16 states, 2010.暴力死亡监测 - 全国暴力死亡报告系统,16 个州,2010 年。
MMWR Surveill Summ. 2014 Jan 17;63(1):1-33.
10
Surveillance for Violent Deaths - National Violent Death Reporting System, 42 States, the District of Columbia, and Puerto Rico, 2019.暴力死亡监测-全国暴力死亡报告系统,42 个州、哥伦比亚特区和波多黎各,2019 年。
MMWR Surveill Summ. 2022 May 20;71(6):1-40. doi: 10.15585/mmwr.ss7106a1.

引用本文的文献

1
Stakeholders' Perspectives on Child Healthcare Services under Rural Health Reform in Thailand: A Qualitative Study.泰国农村卫生改革背景下利益相关者对儿童医疗服务的看法:一项定性研究
Int J Community Based Nurs Midwifery. 2025 Jan 1;13(1):16-27. doi: 10.30476/ijcbnm.2024.102052.2468. eCollection 2025 Jan.
2
State-Level Economic Costs of Fatal Injuries - United States, 2019.2019 年美国致命伤害的州级经济成本。
MMWR Morb Mortal Wkly Rep. 2021 Dec 3;70(48):1660-1663. doi: 10.15585/mmwr.mm7048a2.
3
State-Level Economic Costs of Opioid Use Disorder and Fatal Opioid Overdose - United States, 2017.

本文引用的文献

1
Deaths: Final Data for 2014.死亡:2014年最终数据。
Natl Vital Stat Rep. 2016 Jun;65(4):1-122.
2
CDC Guideline for Prescribing Opioids for Chronic Pain - United States, 2016.美国 2016 年慢性疼痛阿片类药物处方指南。
MMWR Recomm Rep. 2016 Mar 18;65(1):1-49. doi: 10.15585/mmwr.rr6501e1.
3
Estimated Lifetime Medical and Work-Loss Costs of Fatal Injuries--United States, 2013.2013 年美国致命伤害的终生医疗和工作损失成本估算。
2017 年美国阿片类药物使用障碍和致命阿片类药物过量的州级经济成本。
MMWR Morb Mortal Wkly Rep. 2021 Apr 16;70(15):541-546. doi: 10.15585/mmwr.mm7015a1.
4
Average lost work productivity due to non-fatal injuries by type in the USA.因非致命伤导致美国失去的平均工作生产力,按类型划分。
Inj Prev. 2021 Apr;27(2):111-117. doi: 10.1136/injuryprev-2019-043607. Epub 2020 May 4.
5
Cost-effectiveness evaluation of the PROPPR trial transfusion protocols.PROPPR 试验输血方案的成本效果评价。
Transfusion. 2020 May;60(5):922-931. doi: 10.1111/trf.15784. Epub 2020 May 1.
6
Impact of the academic calendar cycle on survival outcome of injured patients: a retrospective cohort study at a community emergency department in Japan.学术日历周期对受伤患者生存结局的影响:日本一家社区急诊科的回顾性队列研究。
J Intensive Care. 2019 Aug 1;7:39. doi: 10.1186/s40560-019-0395-z. eCollection 2019.
7
Heroin and healthcare: patient characteristics and healthcare prior to overdose.海洛因和医疗保健:患者特征和用药过量前的医疗保健。
Am J Manag Care. 2019 Jul;25(7):341-347.
8
Validation of the Korean criteria for trauma team activation.韩国创伤团队启动标准的验证
Clin Exp Emerg Med. 2018 Dec;5(4):256-263. doi: 10.15441/ceem.17.265. Epub 2018 Dec 31.
MMWR Morb Mortal Wkly Rep. 2015 Oct 2;64(38):1074-7. doi: 10.15585/mmwr.mm6438a4.
4
Deaths: final data for 2005.死亡情况:2005年最终数据。
Natl Vital Stat Rep. 2008 Apr 24;56(10):1-120.
5
Variability of undetermined manner of death classification in the US.美国死因分类方式不确定的变异性。
Inj Prev. 2006 Dec;12 Suppl 2(Suppl 2):ii49-ii54. doi: 10.1136/ip.2006.012591.