Li Ka-Loh, Zhu Xiaoping, Zhao Sha, Jackson Alan
Division of Informatics, Imaging and Data Sciences, University of Manchester, Manchester, UK.
CRUK and EPSRC Cancer Imaging Centre in Cambridge and Manchester, Manchester, UK.
J Magn Reson Imaging. 2017 Jul;46(1):79-93. doi: 10.1002/jmri.25573. Epub 2017 Jan 24.
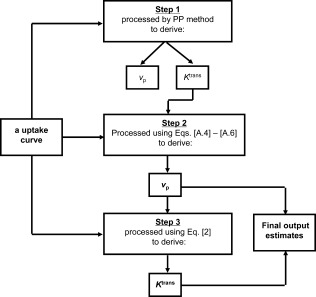
To develop and assess a "hybrid" method that combines a first-pass analytical approach and the Patlak plot (PP) to improve assessment of low blood-brain barrier permeability from dynamic contrast-enhanced (DCE) magnetic resonance imaging (MRI) data.
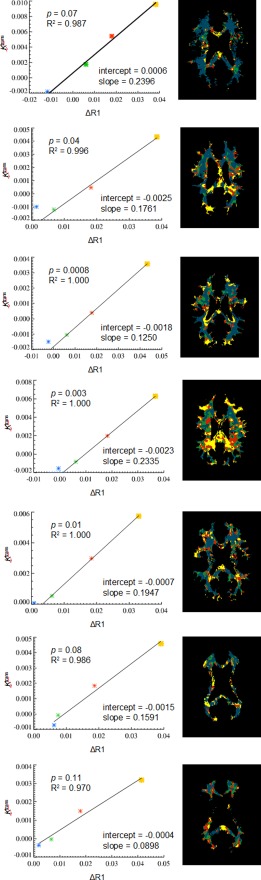
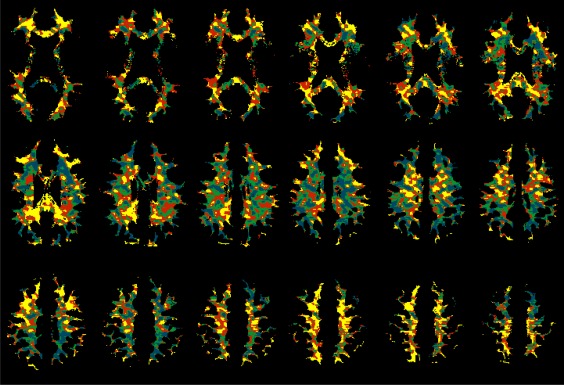
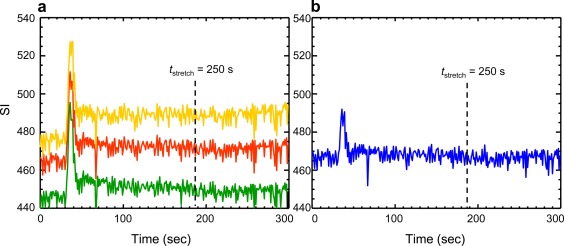
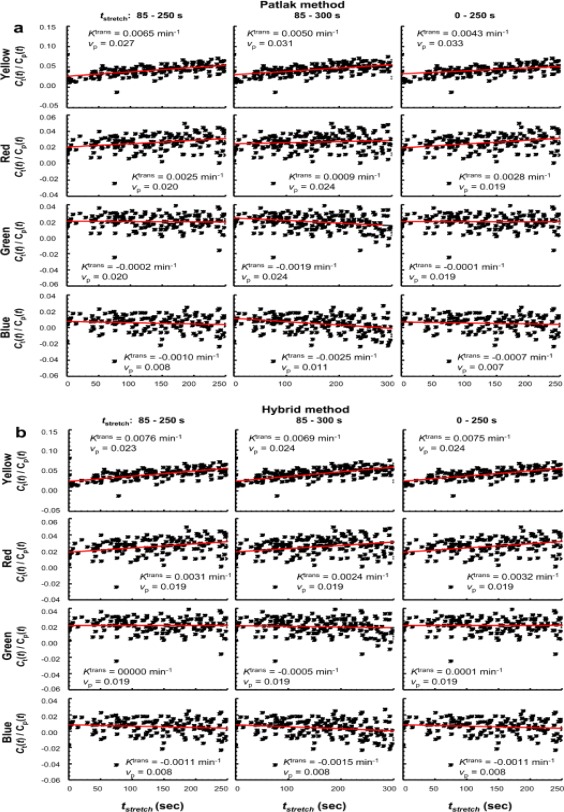
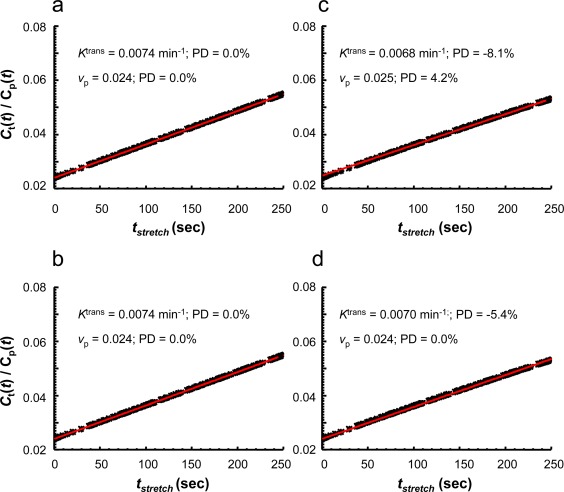
Seven patients with vestibular schwannoma were enrolled. T -W DCE imaging was acquired on a 1.5T scanner. Normal-appearing white matter (NAWM) was divided into four regions of interest (ROIs) based on the magnitude of changes in longitudinal relaxation rate (ΔR1) after gadolinium administration. Kinetic analysis of ROI-averaged contrast agent concentration curves was performed using both the conventional PP and the hybrid method. Computer simulated uptake curves that resemble those from NAWM were analyzed with both methods. Percent deviations (PD) of the "measured" values from the "true" values were calculated to evaluate accuracy and precision of the two methods.
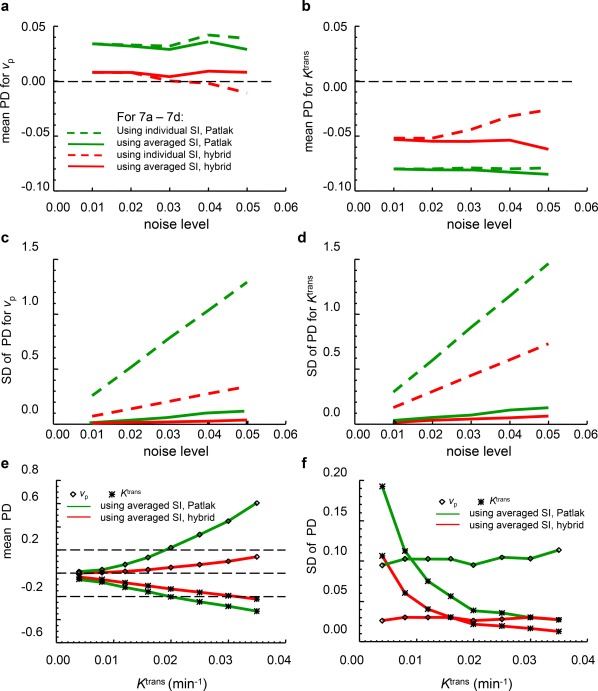
The simulation showed that, at a noise level of 4% (a noise level similar to the in vivo data) and using a signal intensity (SI) averaging scheme, the new hybrid method achieved a PD of 0.9 ± 2.7% for v , and a PD of -5.4 ± 5.9% for K . In comparison, the PP method obtained a PD of 3.6 ± 11.3% for v , and -8.3 ± 12.8% for K . One-way analyses of variance (ANOVAs) showed significant variations from the four WM regions (P < 10 for ΔR1; P < 10 for K ; P < 10 for v ).
Both computer simulation and in vivo studies demonstrate improved reliability in v and K estimates with the hybrid method.
3 Technical Efficacy: Stage 1 J. MAGN. RESON. IMAGING 2017;46:79-93.
开发并评估一种“混合”方法,该方法结合首过分析方法和Patlak图(PP),以改善从动态对比增强(DCE)磁共振成像(MRI)数据评估低血脑屏障通透性的能力。
纳入7例前庭神经鞘瘤患者。在1.5T扫描仪上进行T -W DCE成像。根据钆给药后纵向弛豫率(ΔR1)变化的幅度,将外观正常的白质(NAWM)分为四个感兴趣区域(ROI)。使用传统PP和混合方法对ROI平均造影剂浓度曲线进行动力学分析。用这两种方法分析类似于NAWM摄取曲线的计算机模拟摄取曲线。计算“测量”值与“真实”值的百分比偏差(PD),以评估这两种方法的准确性和精密度。
模拟显示,在4%的噪声水平(类似于体内数据的噪声水平)并使用信号强度(SI)平均方案时,新的混合方法对于v的PD为0.9±2.7%,对于K的PD为 -5.4±5.9%。相比之下,PP方法对于v的PD为3.6±11.3%,对于K的PD为 -8.3±12.8%。单因素方差分析(ANOVA)显示四个白质区域存在显著差异(ΔR1的P<0.01;K的P<0.01;v的P<0.01)。
计算机模拟和体内研究均表明,混合方法在v和K估计方面具有更高的可靠性。
3 技术效能:1期 J.MAGN.RESON.IMAGING 2017;46:79 - 93。