Schandry Niklas
Department of General Genetics, Centre for the Molecular Biology of Plants (ZMBP), University of TübingenTübingen, Germany.
Front Plant Sci. 2017 Apr 24;8:623. doi: 10.3389/fpls.2017.00623. eCollection 2017.
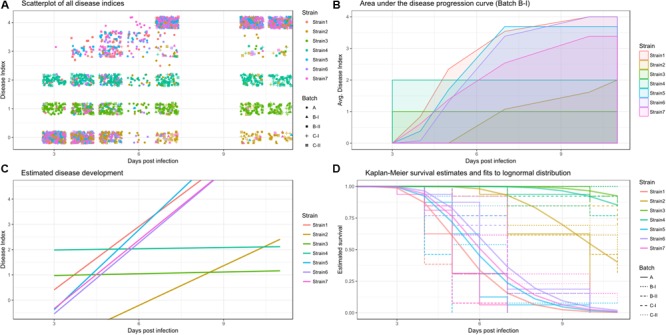
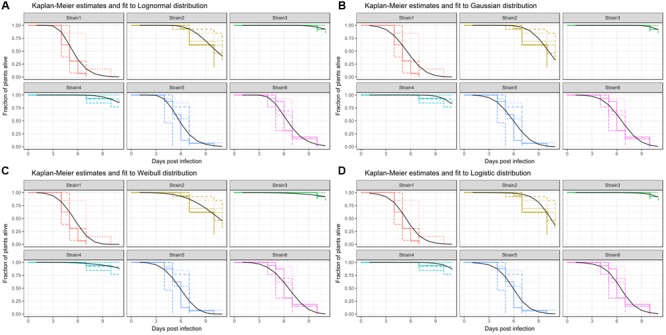
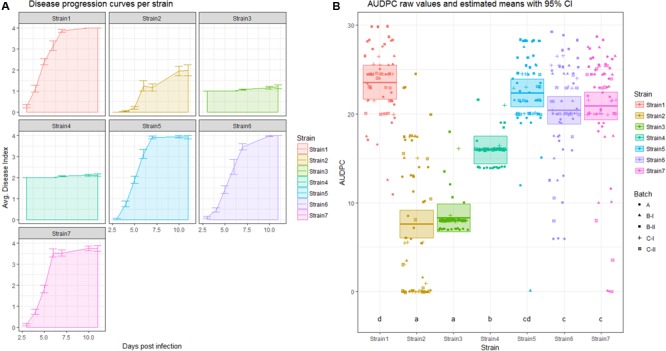
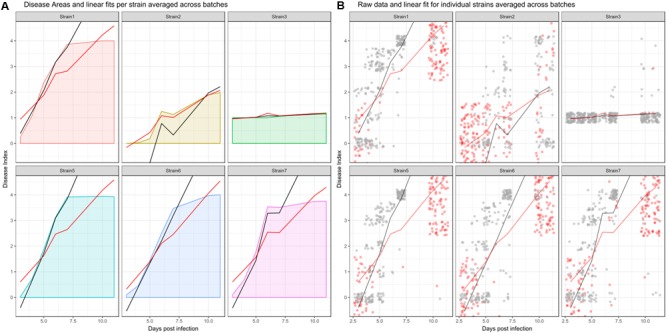
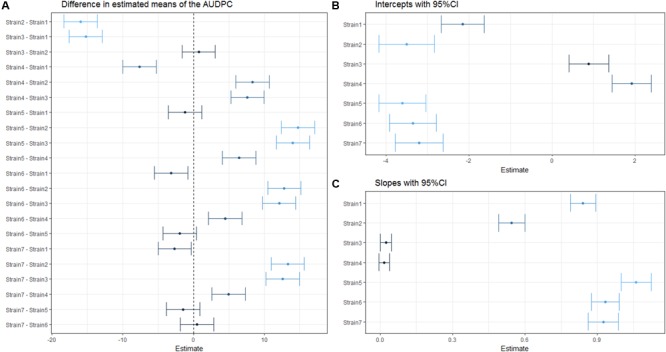
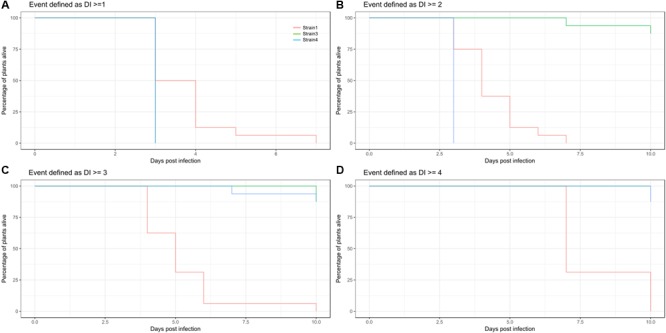
This paper describes and summarizes approaches for visualization and statistical analysis using data from infection experiments based on methods and concepts that are broadly applicable. Members of the species complex cause bacterial wilt disease. Bacterial wilt is a lethal plant disease and has been studied for over 100 years. During this time various methods to quantify disease and different ways to analyze the generated data have been employed. Here, I aim to provide a general background on three distinct and commonly used measures of disease: the area under the disease progression curve, longitudinal recordings of disease severity and host survival. I will discuss how one can proceed with visualization, statistical analysis, and interpretation using different datasets while revisiting the general concepts of statistical analysis. Datasets and R code to perform all analyses discussed here are included in the supplement.
本文基于广泛适用的方法和概念,描述并总结了利用感染实验数据进行可视化和统计分析的方法。该物种复合体的成员会引发青枯病。青枯病是一种致命的植物病害,人们对其研究已超过100年。在此期间,已采用了各种量化病害的方法以及分析所生成数据的不同方式。在这里,我的目的是提供关于三种不同且常用的病害度量方法的一般背景知识:病害进展曲线下的面积、病害严重程度的纵向记录以及宿主存活情况。我将讨论如何使用不同的数据集进行可视化、统计分析和解释,同时回顾统计分析的一般概念。执行此处讨论的所有分析的数据集和R代码包含在补充材料中。