• 文献检索
  • 文档翻译
  • 深度研究
  • 学术资讯
  • Suppr Zotero 插件Zotero 插件
  • 邀请有礼
  • 套餐&价格
  • 历史记录
应用&插件
Suppr Zotero 插件Zotero 插件浏览器插件Mac 客户端Windows 客户端微信小程序
定价
高级版会员购买积分包购买API积分包
服务
文献检索文档翻译深度研究API 文档MCP 服务
关于我们
关于 Suppr公司介绍联系我们用户协议隐私条款
关注我们

Suppr 超能文献

核心技术专利:CN118964589B侵权必究
粤ICP备2023148730 号-1Suppr @ 2026

文献检索

告别复杂PubMed语法,用中文像聊天一样搜索,搜遍4000万医学文献。AI智能推荐,让科研检索更轻松。

立即免费搜索

文件翻译

保留排版,准确专业,支持PDF/Word/PPT等文件格式,支持 12+语言互译。

免费翻译文档

深度研究

AI帮你快速写综述,25分钟生成高质量综述,智能提取关键信息,辅助科研写作。

立即免费体验

英国4至13岁儿童的水及饮料消费模式。

Water and beverage consumption patterns among 4 to 13-year-old children in the United Kingdom.

作者信息

Vieux Florent, Maillot Matthieu, Constant Florence, Drewnowski Adam

机构信息

MS-Nutrition, Faculté de Médecine La Timone, Marseille, France.

Nestlé Waters M.T, 12 boulevard Garibaldi, 92130, Issy-les-Moulineaux, France.

出版信息

BMC Public Health. 2017 May 19;17(1):479. doi: 10.1186/s12889-017-4400-y.

DOI:10.1186/s12889-017-4400-y
PMID:28525992
原文链接:https://pmc.ncbi.nlm.nih.gov/articles/PMC5438525/
Abstract

BACKGROUND

The UK government has announced a tax on sugar-sweetened beverages. The aim of this study was to assess consumption patterns for plain drinking water relative to sugary beverages among UK children.

METHODS

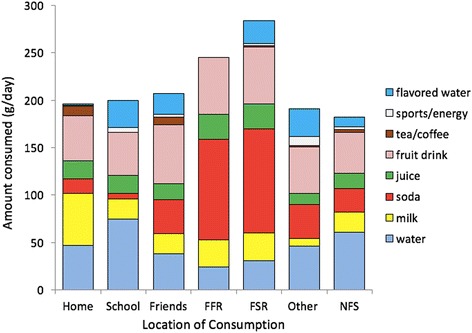
Dietary intake data for 845 children aged 4-13 years came from the nationally representative cross-sectional National Diet and Nutrition Survey, 2008-2011. Beverage categories were drinking water (tap or bottled), milk, 100% fruit juices, soda, fruit drinks, tea, coffee, sports drinks, flavored waters, and liquid supplements. Consumption patterns were examined by age group, gender, household incomes, time and location of consumption, region and seasonality. Total water consumption from drinking water, beverages, and foods, and the water-to-calorie ratios (L/kcal) were compared to the EFSA (European Food Safety Authority) adequate intake standards.

RESULTS

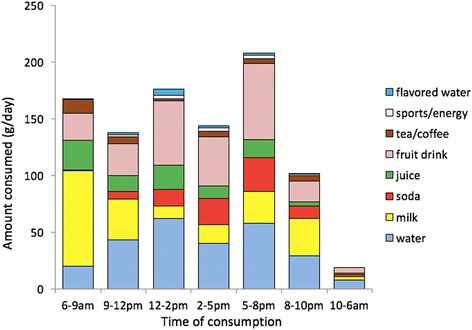
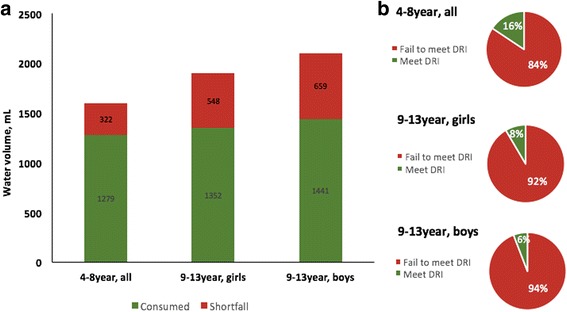
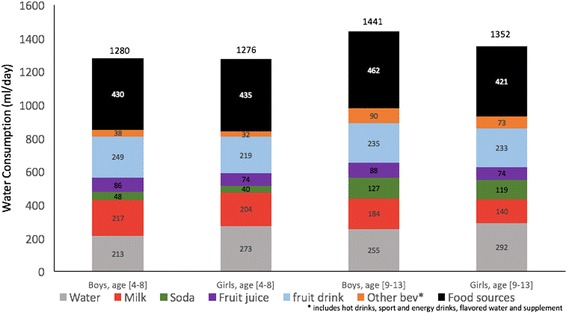
Total water intake (1338 ml/d) came from plain water (19%), beverages (48%), and food moisture (33%). Plain drinking water provided 258 g/d (241 g/d for children aged 4-8 years; 274 g/d for 9-13 years), mostly (83.8%) from tap. Water and beverages supplied 901 g /d of water. Tap water consumption increased with income and was highest in the South of England. The consumption of bottled water, soda, tea and coffee increased with age, whereas milk consumption declined. About 88.7% of children did not meet EFSA adequate intake standards. The daily water shortfall ranged from 322 ml/d to 659 ml/d. Water-to-calorie ratio was 0.845 L/1000 kcal short of desirable levels of 1.0-1.5 L/1000 kcal.

CONCLUSION

Total water intake were at 74.8% of EFSA reference values. Drinking water consumption among children in the UK was well below US and French estimates.

摘要

背景

英国政府已宣布对含糖饮料征税。本研究的目的是评估英国儿童中相对于含糖饮料而言的普通饮用水消费模式。

方法

845名4至13岁儿童的饮食摄入数据来自具有全国代表性的2008 - 2011年横断面全国饮食与营养调查。饮料类别包括饮用水(自来水或瓶装水)、牛奶、100%果汁、汽水、果汁饮料、茶、咖啡、运动饮料、调味水和液体补充剂。按年龄组、性别、家庭收入、消费时间和地点、地区以及季节性对消费模式进行了研究。将饮用水、饮料和食物中的总水摄入量以及水与卡路里的比率(升/千卡)与欧洲食品安全局(EFSA)的充足摄入量标准进行了比较。

结果

总水摄入量(1338毫升/天)来自普通水(19%)、饮料(48%)和食物水分(33%)。普通饮用水提供258克/天(4至8岁儿童为241克/天;9至13岁为274克/天),大部分(83.8%)来自自来水。水和饮料提供了901克/天的水。自来水消费量随收入增加而增加,在英格兰南部最高。瓶装水、汽水、茶和咖啡的消费量随年龄增长而增加,而牛奶消费量下降。约88.7%的儿童未达到EFSA充足摄入量标准。每日水缺口在322毫升/天至659毫升/天之间。水与卡路里的比率比理想水平1.0 - 1.5升/1000千卡低0.845升/1000千卡。

结论

总水摄入量为EFSA参考值的74.8%。英国儿童的饮用水消费量远低于美国和法国的估计值。

https://cdn.ncbi.nlm.nih.gov/pmc/blobs/ca06/5438525/dfac97f79535/12889_2017_4400_Fig4_HTML.jpg
https://cdn.ncbi.nlm.nih.gov/pmc/blobs/ca06/5438525/e8db8eb0b281/12889_2017_4400_Fig1_HTML.jpg
https://cdn.ncbi.nlm.nih.gov/pmc/blobs/ca06/5438525/99cee72f0cbb/12889_2017_4400_Fig2_HTML.jpg
https://cdn.ncbi.nlm.nih.gov/pmc/blobs/ca06/5438525/4c5ea1c87953/12889_2017_4400_Fig3_HTML.jpg
https://cdn.ncbi.nlm.nih.gov/pmc/blobs/ca06/5438525/dfac97f79535/12889_2017_4400_Fig4_HTML.jpg

相似文献

1
Water and beverage consumption patterns among 4 to 13-year-old children in the United Kingdom.英国4至13岁儿童的水及饮料消费模式。
BMC Public Health. 2017 May 19;17(1):479. doi: 10.1186/s12889-017-4400-y.
2
Water and beverage consumption among children age 4-13y in the United States: analyses of 2005-2010 NHANES data.美国4至13岁儿童的水和饮料消费情况:对2005 - 2010年美国国家健康与营养检查调查(NHANES)数据的分析
Nutr J. 2013 Jun 19;12:85. doi: 10.1186/1475-2891-12-85.
3
Water and beverage consumption among adults in the United States: cross-sectional study using data from NHANES 2005-2010.美国成年人的水和饮料消费:使用 NHANES 2005-2010 数据的横断面研究。
BMC Public Health. 2013 Nov 12;13:1068. doi: 10.1186/1471-2458-13-1068.
4
Water and beverage consumption among children aged 4-13 years in France: analyses of INCA 2 (Étude Individuelle Nationale des Consommations Alimentaires 2006-2007) data.法国4至13岁儿童的水及饮料消费情况:基于INCA 2(2006 - 2007年全国个体饮食消费研究)数据的分析
Public Health Nutr. 2016 Sep;19(13):2305-14. doi: 10.1017/S1368980015003614. Epub 2016 Feb 16.
5
Trends in tap and bottled water consumption among children and adults in the United States: analyses of NHANES 2011-16 data.美国儿童和成人的自来水龙头水和瓶装水消费趋势:NHANES 2011-16 数据分析。
Nutr J. 2020 Jan 29;19(1):10. doi: 10.1186/s12937-020-0523-6.
6
Beverage intake among preschool children and its effect on weight status.学龄前儿童的饮料摄入量及其对体重状况的影响。
Pediatrics. 2006 Oct;118(4):e1010-8. doi: 10.1542/peds.2005-2348.
7
Caloric beverages were major sources of energy among children and adults in Mexico, 1999-2012.在 1999 年至 2012 年间,含热量饮料是墨西哥儿童和成年人的主要能量来源。
J Nutr. 2014 Jun;144(6):949-56. doi: 10.3945/jn.114.190652. Epub 2014 Apr 17.
8
Changing beverage consumption patterns have resulted in fewer liquid calories in the diets of US children: National Health and Nutrition Examination Survey 2001-2010.饮料消费模式的改变使美国儿童饮食中的液体热量减少:2001 - 2010年国家健康与营养检查调查。
J Acad Nutr Diet. 2015 Apr;115(4):559-66.e4. doi: 10.1016/j.jand.2014.09.004. Epub 2014 Nov 7.
9
Beverage consumption and energy intake among Canadians: analyses of 2004 and 2015 national dietary intake data.加拿大的饮料消费和能量摄入:2004 年和 2015 年全国饮食摄入数据的分析。
Nutr J. 2019 Oct 18;18(1):60. doi: 10.1186/s12937-019-0488-5.
10
Beverage consumption habits "24/7" among British adults: association with total water intake and energy intake.英国成年人 24/7 随时都在喝饮料:与总水分摄入和能量摄入有关。
Nutr J. 2013 Jan 10;12:9. doi: 10.1186/1475-2891-12-9.

引用本文的文献

1
Total Water and Energy Intake Among Preschool Children in China: A Cross-Sectional Analysis Based on National Survey Data.中国学龄前儿童的总水和能量摄入量:基于全国调查数据的横断面分析
Nutrients. 2025 Aug 15;17(16):2645. doi: 10.3390/nu17162645.
2
Peer education program to improve fluid consumption in primary schools-lessons learned from an innovative pilot study.同伴教育计划改善小学饮水情况——从一项创新性试点研究中获得的经验教训
Heliyon. 2024 Feb 23;10(5):e26769. doi: 10.1016/j.heliyon.2024.e26769. eCollection 2024 Mar 15.
3
Decreasing consumption of sugar-sweetened beverages and Raising tap water consumption through Interventions based on Nutrition and sustainability for Kids: study protocol of the "DRINK" cluster randomised controlled trial.

本文引用的文献

1
Water and beverage consumption among children aged 4-13 years in France: analyses of INCA 2 (Étude Individuelle Nationale des Consommations Alimentaires 2006-2007) data.法国4至13岁儿童的水及饮料消费情况:基于INCA 2(2006 - 2007年全国个体饮食消费研究)数据的分析
Public Health Nutr. 2016 Sep;19(13):2305-14. doi: 10.1017/S1368980015003614. Epub 2016 Feb 16.
2
Total fluid intake of children and adolescents: cross-sectional surveys in 13 countries worldwide.儿童和青少年的总液体摄入量:全球13个国家的横断面调查
Eur J Nutr. 2015 Jun;54 Suppl 2(Suppl 2):57-67. doi: 10.1007/s00394-015-0946-6. Epub 2015 Jun 18.
3
通过基于营养和可持续性的儿童干预措施减少含糖饮料的消费和提高自来水的消费:“DRINK”群组随机对照试验的研究方案。
Trials. 2023 Sep 26;24(1):611. doi: 10.1186/s13063-023-07643-z.
4
The Severity of Obesity Promotes Greater Dehydration in Children: Preliminary Results.肥胖程度加重会导致儿童脱水更严重:初步研究结果。
Nutrients. 2022 Dec 3;14(23):5150. doi: 10.3390/nu14235150.
5
Contribution of household drinking water intake to arsenic and lead exposure among Uruguayan schoolchildren.家庭饮用水摄入对乌拉圭学童砷和铅暴露的影响。
Chemosphere. 2022 Apr;292:133525. doi: 10.1016/j.chemosphere.2022.133525. Epub 2022 Jan 5.
6
Like parent, like child: a cross-sectional study of intra-household consumption patterns of non-alcoholic beverages among British households with children.有其父必有其子:英国家庭中有孩子的家庭内部非酒精饮料消费模式的横断面研究。
Public Health Nutr. 2022 Jul;25(7):1771-1779. doi: 10.1017/S1368980021005061. Epub 2021 Dec 27.
7
Promoting water consumption among Dutch children: an evaluation of the social network intervention Share HO.促进荷兰儿童饮水:社会网络干预 Share HO 的评估。
BMC Public Health. 2021 Jan 22;21(1):202. doi: 10.1186/s12889-021-10161-9.
8
Comparative Analysis of the Effects of Daily Eating Habits and Physical Activity on Anthropometric Parameters in Elementary School Children in Latvia: Pach Study.拉脱维亚小学生日常饮食习惯和身体活动对人体测量参数影响的比较分析:Pach 研究。
Nutrients. 2020 Dec 14;12(12):3818. doi: 10.3390/nu12123818.
9
Correlates of sugar-sweetened beverages consumption among adolescents.青少年含糖饮料消费的相关因素。
Public Health Nutr. 2020 Aug;23(12):2145-2154. doi: 10.1017/S1368980019005147. Epub 2020 May 8.
10
Urban Water Consumption Patterns in an Adult Population in Wuxi, China: A Regression Tree Analysis.中国无锡市成年人的城市用水模式:回归树分析。
Int J Environ Res Public Health. 2020 Apr 25;17(9):2983. doi: 10.3390/ijerph17092983.
Intake of water and beverages of children and adolescents in 13 countries.
13个国家儿童和青少年的水及饮料摄入量。
Eur J Nutr. 2015 Jun;54 Suppl 2(Suppl 2):69-79. doi: 10.1007/s00394-015-0955-5. Epub 2015 Jun 14.
4
Fluid intake survey among schoolchildren in Belgium.比利时学童的液体摄入量调查。
BMC Public Health. 2014 Jun 26;14:651. doi: 10.1186/1471-2458-14-651.
5
Current patterns of water and beverage consumption among Mexican children and adolescents aged 1-18 years: analysis of the Mexican National Health and Nutrition Survey 2012.墨西哥1至18岁儿童及青少年当前的水和饮料消费模式:对2012年墨西哥国家健康与营养调查的分析
Public Health Nutr. 2014 Oct;17(10):2166-75. doi: 10.1017/S1368980014000998. Epub 2014 May 27.
6
Caloric beverages were major sources of energy among children and adults in Mexico, 1999-2012.在 1999 年至 2012 年间,含热量饮料是墨西哥儿童和成年人的主要能量来源。
J Nutr. 2014 Jun;144(6):949-56. doi: 10.3945/jn.114.190652. Epub 2014 Apr 17.
7
Water and beverage consumption among adults in the United States: cross-sectional study using data from NHANES 2005-2010.美国成年人的水和饮料消费:使用 NHANES 2005-2010 数据的横断面研究。
BMC Public Health. 2013 Nov 12;13:1068. doi: 10.1186/1471-2458-13-1068.
8
Water and beverage consumption among children age 4-13y in the United States: analyses of 2005-2010 NHANES data.美国4至13岁儿童的水和饮料消费情况:对2005 - 2010年美国国家健康与营养检查调查(NHANES)数据的分析
Nutr J. 2013 Jun 19;12:85. doi: 10.1186/1475-2891-12-85.
9
Factors associated with low water intake among US high school students - National Youth Physical Activity and Nutrition Study, 2010.与美国高中生低水摄入量相关的因素 - 全国青少年体力活动与营养研究,2010 年。
J Acad Nutr Diet. 2012 Sep;112(9):1421-1427. doi: 10.1016/j.jand.2012.04.014. Epub 2012 Jun 28.
10
Extended international (IOTF) body mass index cut-offs for thinness, overweight and obesity.国际肥胖工作组(IOTF)制定的消瘦、超重和肥胖的扩展身体质量指数临界值。
Pediatr Obes. 2012 Aug;7(4):284-94. doi: 10.1111/j.2047-6310.2012.00064.x. Epub 2012 Jun 19.