Sig-Nurture Ltd., Guildford, Surrey Gu1 2TF, UK.
Nutr J. 2013 Jan 10;12:9. doi: 10.1186/1475-2891-12-9.
Various recommendations exist for total water intake (TWI), yet it is seldom reported in dietary surveys. Few studies have examined how real-life consumption patterns, including beverage type, variety and timing relate to TWI and energy intake (EI).
We analysed weighed dietary records from the National Diet and Nutrition Survey of 1724 British adults aged 19-64 years (2000/2001) to investigate beverage consumption patterns over 24 hrs and 7 days and associations with TWI and EI. TWI was calculated from the nutrient composition of each item of food and drink and compared with reference values.
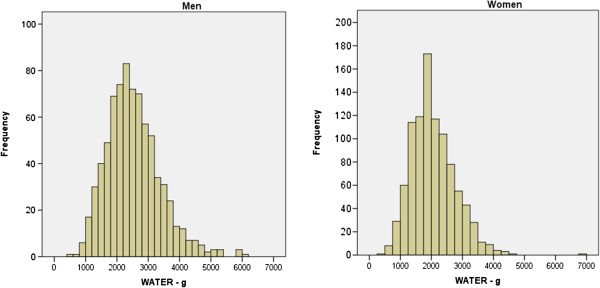
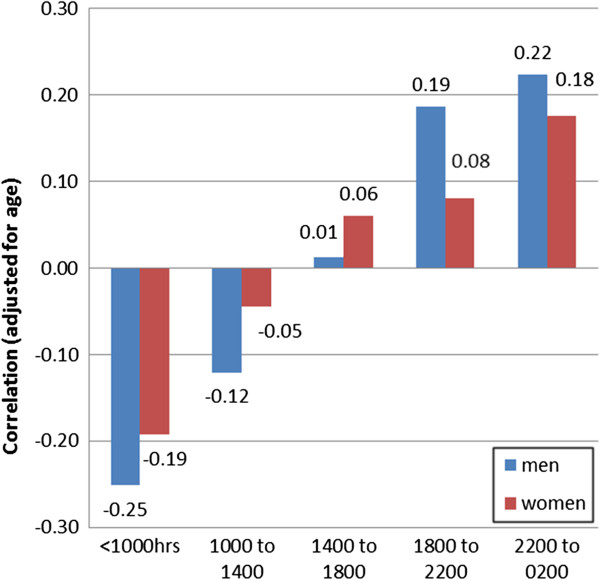
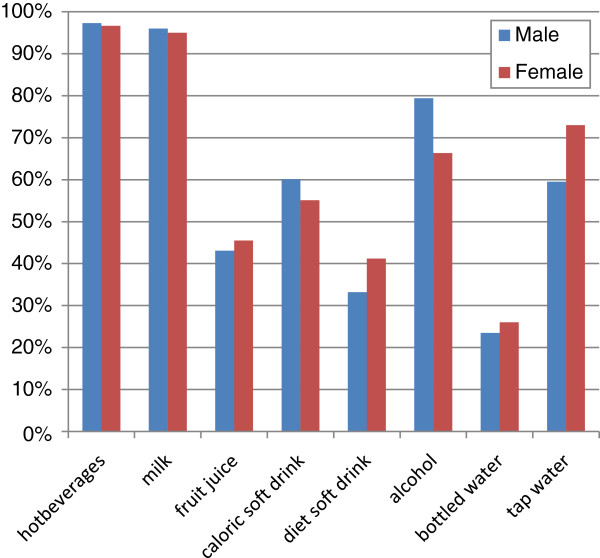
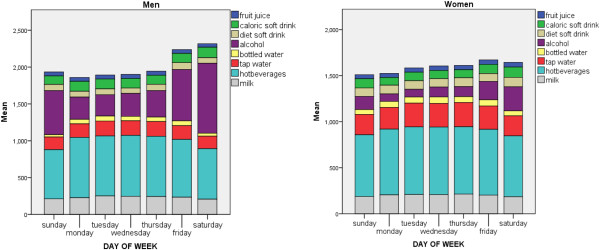
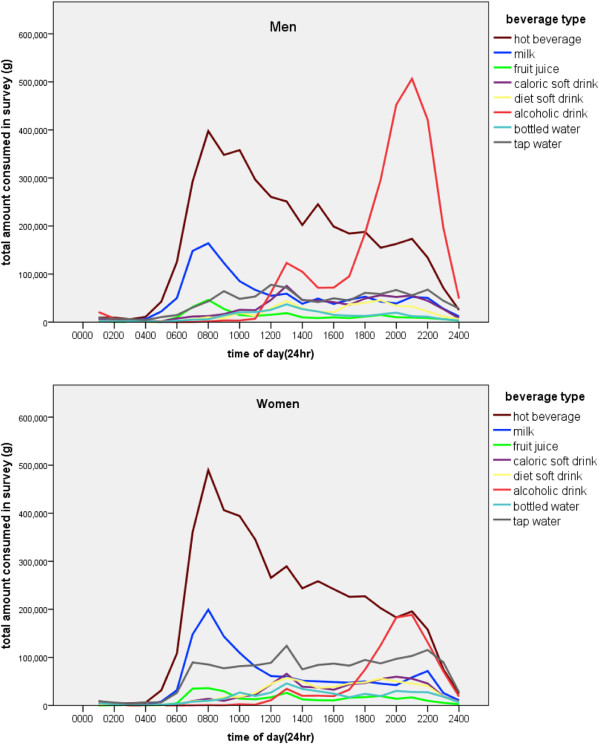
Mean TWI was 2.53 L (SD 0.86) for men and 2.03 L (SD 0.71) for women, close to the European Food Safety Authority "adequate Intake" (AI) of 2.5 L and 2 L, respectively. However, for 33% of men and 23% of women TWI was below AI and TWI:EI ratio was <1 g/kcal. Beverages accounted for 75% of TWI. Beverage variety was correlated with TWI (r 0.34) and more weakly with EI (r 0.16). Beverage consumption peaked at 0800 hrs (mainly hot beverages/ milk) and 2100 hrs (mainly alcohol). Total beverage consumption was higher at weekends, especially among men. Overall, beverages supplied 16% of EI (men 17%, women 14%), alcoholic drinks contributed 9% (men) and 5% (women), milk 5-6%, caloric soft drinks 2%, and fruit juice 1%.In multi-variable regression (adjusted for sex, age, body weight, smoking, dieting, activity level and mis-reporting), replacing 100 g of caloric beverages (milk, fruit juice, caloric soft drinks and alcohol) with 100 g non-caloric drinks (diet soft drinks, hot beverages and water) was associated with a reduction in EI of 15 kcal, or 34 kcal if food energy were unchanged. Using within-person data (deviations from 7-day mean) each 100 g change in caloric beverages was associated with 29 kcal change in EI or 35 kcal if food energy were constant. By comparison the calculated energy content of caloric drinks consumed was 47 kcal/100 g.
TWI and beverage consumption are closely related, and some individuals appeared to have low TWI. Compensation for energy from beverages may occur but is partial. A better understanding of interactions between drinking and eating habits and their impact on water and energy balance would give a firmer basis to dietary recommendations.
有各种各样的关于总饮水量(TWI)的建议,但在饮食调查中很少有报道。很少有研究探讨现实生活中的消费模式,包括饮料类型、种类和时间,与 TWI 和能量摄入(EI)之间的关系。
我们分析了 1724 名年龄在 19-64 岁的英国成年人的全国饮食与营养调查的称重饮食记录,以调查 24 小时和 7 天内的饮料消费模式,并研究其与 TWI 和 EI 的关系。TWI 是根据每种食物和饮料的营养成分计算出来的,并与参考值进行了比较。
男性的平均 TWI 为 2.53 升(SD 0.86),女性为 2.03 升(SD 0.71),接近欧洲食品安全局(EFSA)分别为 2.5 升和 2 升的“适宜摄入量”(AI)。然而,33%的男性和 23%的女性的 TWI 低于 AI,且 TWI:EI 比值<1g/kcal。饮料占 TWI 的 75%。饮料种类与 TWI(r 0.34)呈正相关,与 EI(r 0.16)的相关性较弱。饮料消费高峰出现在 0800 小时(主要是热饮/牛奶)和 2100 小时(主要是酒精)。周末的总饮料消费更高,尤其是男性。总的来说,饮料提供了 16%的 EI(男性 17%,女性 14%),酒精饮料占 9%(男性)和 5%(女性),牛奶占 5-6%,含热量软饮料占 2%,果汁占 1%。在多变量回归(按性别、年龄、体重、吸烟、节食、活动水平和报告错误调整)中,用 100 克无热量饮料(无糖软饮料、热饮和水)代替 100 克含热量饮料(牛奶、果汁、含热量软饮料和酒精)与 EI 减少 15 卡路里相关,如果食物能量不变,则减少 34 卡路里。如果使用个体内数据(7 天平均值的偏差),则每 100 克含热量饮料的变化与 EI 变化 29 卡路里相关,如果食物能量不变,则与 EI 变化 35 卡路里相关。相比之下,计算出的含热量饮料的能量含量为每 100 克 47 卡路里。
TWI 和饮料消费密切相关,一些人似乎 TWI 较低。可能会从饮料中补偿能量,但这种补偿是部分的。更好地了解饮食和饮食习惯之间的相互作用及其对水和能量平衡的影响,将为饮食建议提供更坚实的基础。