Unal Ilker
School of Medicine, Department of Biostatistics, Cukurova University, Saricam, Adana, Turkey.
Comput Math Methods Med. 2017;2017:3762651. doi: 10.1155/2017/3762651. Epub 2017 May 31.
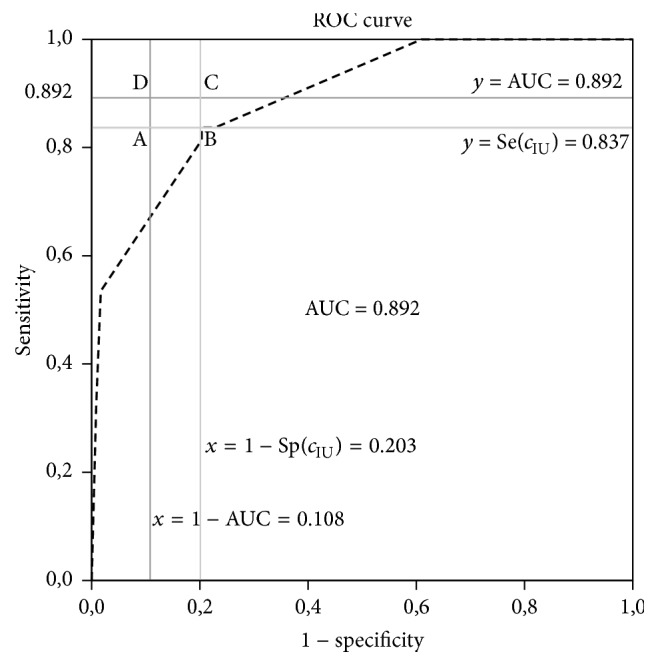
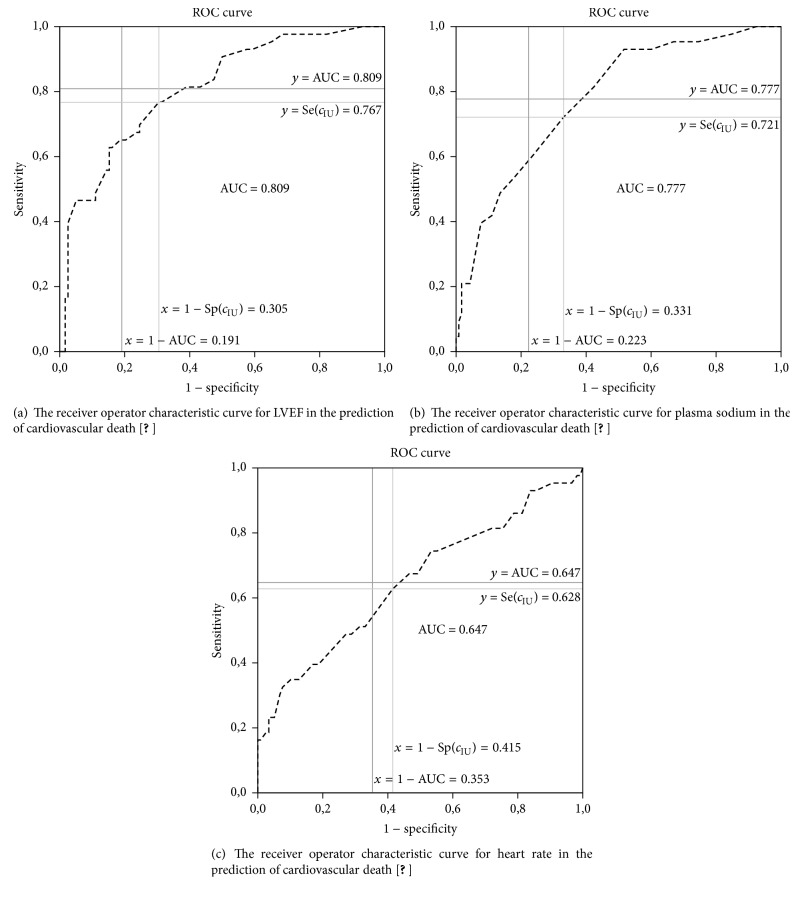
ROC curve analysis is often applied to measure the diagnostic accuracy of a biomarker. The analysis results in two gains: diagnostic accuracy of the biomarker and the optimal cut-point value. There are many methods proposed in the literature to obtain the optimal cut-point value. In this study, a new approach, alternative to these methods, is proposed. The proposed approach is based on the value of the area under the ROC curve. This method defines the optimal cut-point value as the value whose sensitivity and specificity are the closest to the value of the area under the ROC curve and the absolute value of the difference between the sensitivity and specificity values is minimum. This approach is very practical. In this study, the results of the proposed method are compared with those of the standard approaches, by using simulated data with different distribution and homogeneity conditions as well as a real data. According to the simulation results, the use of the proposed method is advised for finding the true cut-point.
ROC曲线分析常用于衡量生物标志物的诊断准确性。该分析产生两个结果:生物标志物的诊断准确性和最佳切点值。文献中提出了许多方法来获得最佳切点值。在本研究中,提出了一种不同于这些方法的新方法。所提出的方法基于ROC曲线下面积的值。该方法将最佳切点值定义为其灵敏度和特异度最接近ROC曲线下面积的值且灵敏度和特异度值之间差异的绝对值最小的值。这种方法非常实用。在本研究中,通过使用具有不同分布和同质性条件的模拟数据以及真实数据,将所提出方法的结果与标准方法的结果进行了比较。根据模拟结果,建议使用所提出的方法来寻找真正的切点。