Pavlopoulos Georgios A, Paez-Espino David, Kyrpides Nikos C, Iliopoulos Ioannis
Department of Energy, Joint Genome Institute, Lawrence Berkeley Labs, 2800 Mitchell Drive, Walnut Creek, CA 94598, USA.
Division of Basic Sciences, University of Crete Medical School, Andrea Kalokerinou Street, Heraklion, Greece.
Adv Bioinformatics. 2017;2017:1278932. doi: 10.1155/2017/1278932. Epub 2017 Jul 18.
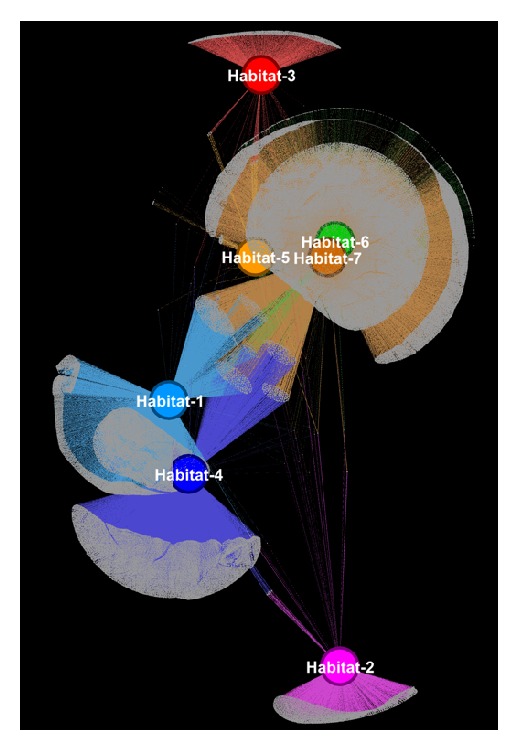
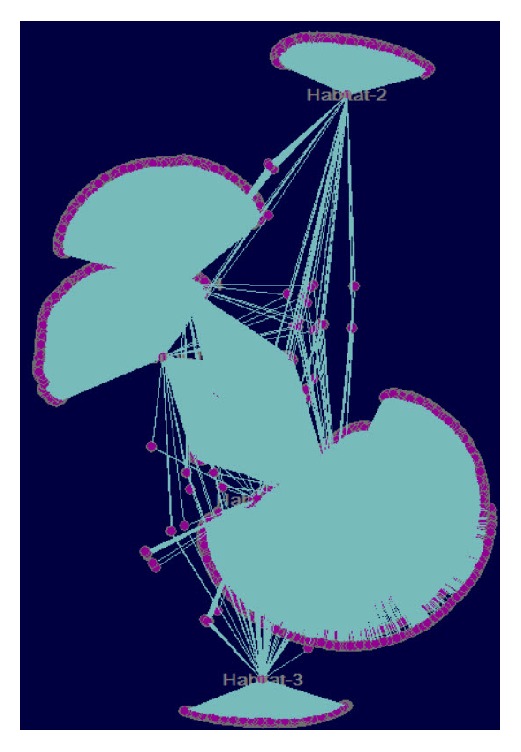
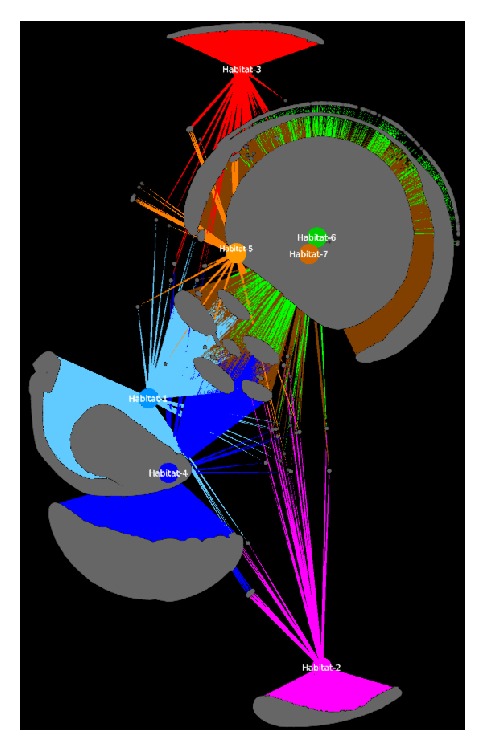
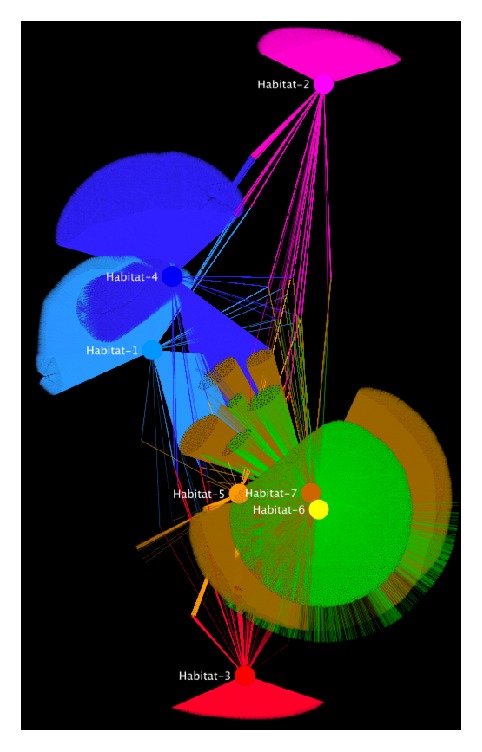
Gene expression, signal transduction, protein/chemical interactions, biomedical literature cooccurrences, and other concepts are often captured in biological network representations where nodes represent a certain bioentity and edges the connections between them. While many tools to manipulate, visualize, and interactively explore such networks already exist, only few of them can scale up and follow today's indisputable information growth. In this review, we shortly list a catalog of available network visualization tools and, from a user-experience point of view, we identify four candidate tools suitable for larger-scale network analysis, visualization, and exploration. We comment on their strengths and their weaknesses and empirically discuss their scalability, user friendliness, and postvisualization capabilities.
基因表达、信号转导、蛋白质/化学相互作用、生物医学文献共现以及其他概念通常在生物网络表示中得以体现,其中节点代表特定的生物实体,边代表它们之间的连接。虽然已经存在许多用于操纵、可视化和交互式探索此类网络的工具,但其中只有少数能够扩展并跟上当今无可争议的信息增长速度。在本综述中,我们简要列出了可用网络可视化工具的目录,并从用户体验的角度确定了四种适用于大规模网络分析、可视化和探索的候选工具。我们对它们的优点和缺点进行了评论,并实证讨论了它们的可扩展性、用户友好性和可视化后处理能力。