Treff Gunnar, Winkert Kay, Sareban Mahdi, Steinacker Jürgen M, Becker Martin, Sperlich Billy
Division of Sports and Rehabilitation Medicine, Ulm University HospitalUlm, Germany.
Institute of Sports Medicine, Prevention and Rehabilitation, Paracelsus Medical UniversitySalzburg, Austria.
Front Physiol. 2017 Aug 2;8:515. doi: 10.3389/fphys.2017.00515. eCollection 2017.
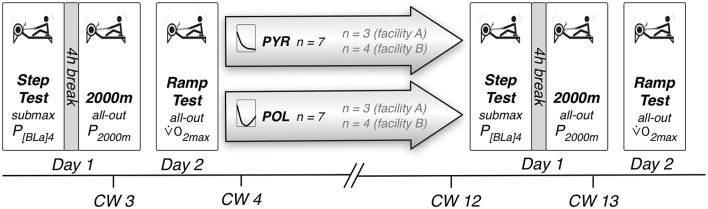
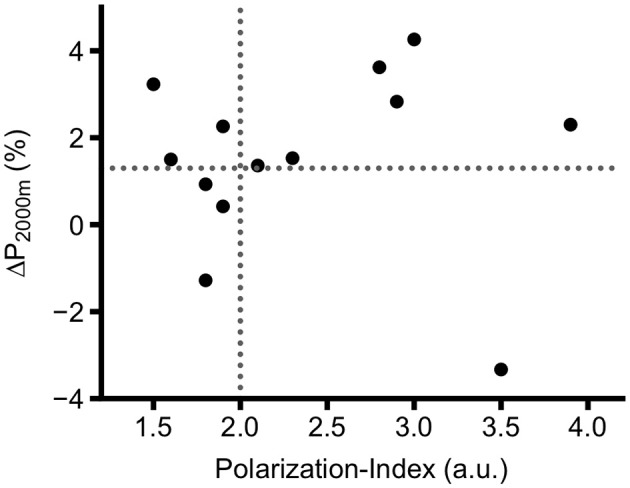
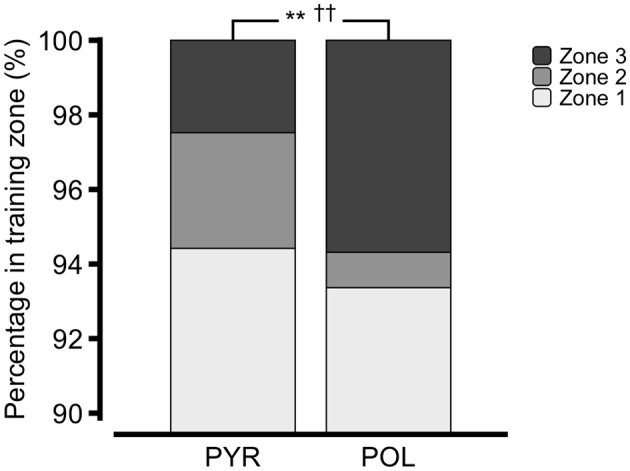
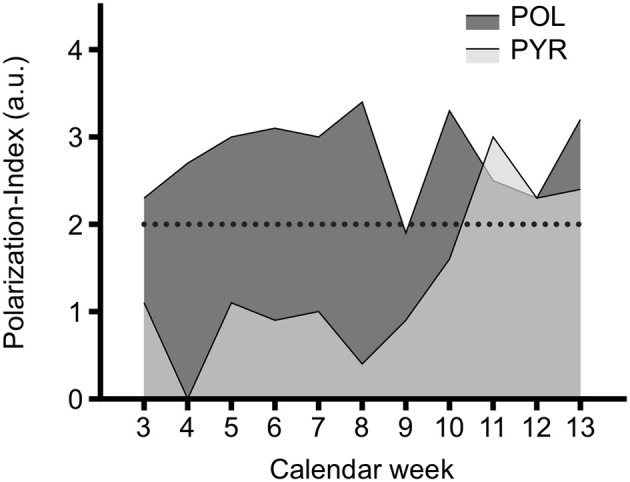
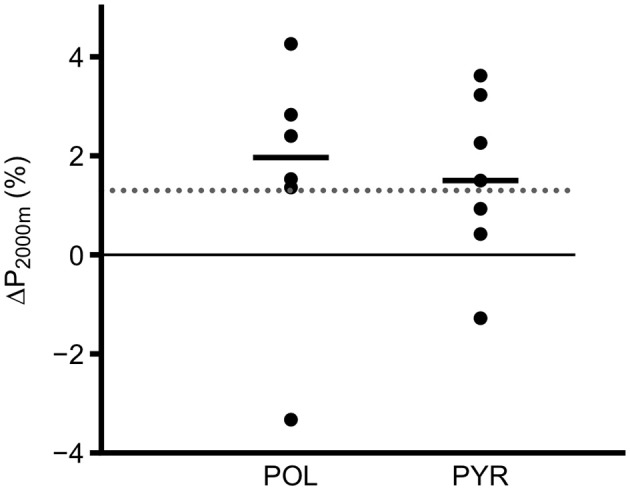
Polarized (POL) training intensity distribution (TID) emphasizes high-volume low-intensity exercise in zone (Z)1 (< first lactate threshold) with a greater proportion of high-intensity Z3 (>second lactate threshold) compared to Z2 (between first and second lactate threshold). In highly trained rowers there is a lack of prospective controlled evidence whether POL is superior to pyramidal (PYR; i.e., greater volume in Z1 vs. Z2 vs. Z3) TID. The aim of the study was to compare the effect of POL vs. PYR TID in rowers during an 11-wk preparation period. Fourteen national elite male rowers participated (age: 20 ± 2 years, maximal oxygen uptake ([Formula: see text]O): 66 ± 5 mL/min/kg). The sample was split into PYR and POL by varying the percentage spent in Z2 and Z3 while Z1 was clamped to ~93% and matched for total and rowing volume. Actual TIDs were based on time within heart rate zones (Z1 and Z2) and duration of Z3-intervals. The main outcome variables were average power in 2,000 m ergometer-test (P), power associated with 4 mmol/L [blood lactate] (P), and [Formula: see text]O. To quantify the level of polarization, we calculated a Polarization-Index as log (%Z1 × %Z3 / %Z2). PYR and POL did not significantly differ regarding rowing or total volume, but POL had a higher percentage of Z3 intensities (6 ± 3 vs. 2 ± 1%; < 0.005) while Z2 was lower (1 ± 1 vs. 3 ± 2%; < 0.05) and Z1 was similar (94 ± 3 vs. 93 ± 2%, = 0.37). Consequently, Polarization-Index was significantly higher in POL (3.0 ± 0.7 vs. 1.9 ± 0.4 a.u.; < 0.01). P did not significantly change with PYR (1.5 ± 1.7%, = 0.06) nor POL (1.5 ± 2.6%, = 0.26). [Formula: see text] did not change (1.7 ± 5.6%, = 0.52 or 0.6 ± 2.6, = 0.67) and a small increase in P was observed in PYR only (1.9 ± 4.8%, = 0.37 or -0.5 ± 4.1%, = 0.77). Changes from pre to post were not significantly different between groups in any performance measure. POL did not prove to be superior to PYR, possibly due to the high and very similar percentage of Z1 in this study.
极化(POL)训练强度分布(TID)强调在1区(<第一乳酸阈值)进行大量低强度运动,与2区(第一和第二乳酸阈值之间)相比,3区(>第二乳酸阈值)的高强度运动比例更高。在高水平赛艇运动员中,缺乏前瞻性对照证据表明POL是否优于金字塔形(PYR;即1区、2区和3区运动量依次递减)TID。本研究的目的是比较POL与PYR TID在赛艇运动员11周准备期的效果。14名国家精英男子赛艇运动员参与研究(年龄:20±2岁,最大摄氧量([公式:见正文]O):66±5 mL/min/kg)。通过改变2区和3区的时间占比将样本分为PYR组和POL组,同时将1区时间占比固定在~93%,并使总运动量和划船运动量相匹配。实际TID基于心率区间(1区和2区)内的时间以及3区间隔的持续时间。主要结局变量为2000米测力计测试中的平均功率(P)、与4 mmol/L[血乳酸]相关的功率(P)以及[公式:见正文]O。为量化极化水平,我们计算了极化指数,即log(%1区×%3区/%2区)。PYR组和POL组在划船或总运动量方面无显著差异,但POL组3区强度百分比更高(6±3%对2±1%;<0.005),而2区更低(1±1%对3±2%;<0.05),1区相似(94±3%对93±2%,=0.37)。因此,POL组的极化指数显著更高(3.0±0.7对1.9±0.4任意单位;<0.01)。PYR组(1.5±1.7%,=0.06)和POL组(1.5±2.6%,=0.26)的P均无显著变化。[公式:见正文]无变化(1.7±5.6%,=0.52或0.6±2.6,=0.67),仅PYR组的P有小幅增加(1.9±4.8%,=0.37或 -0.5±4.1%,=0.77)。在任何性能指标上,两组从训练前到训练后的变化均无显著差异。POL并未被证明优于PYR,可能是由于本研究中1区的时间占比很高且非常相似。