• 文献检索
  • 文档翻译
  • 深度研究
  • 学术资讯
  • Suppr Zotero 插件Zotero 插件
  • 邀请有礼
  • 套餐&价格
  • 历史记录
应用&插件
Suppr Zotero 插件Zotero 插件浏览器插件Mac 客户端Windows 客户端微信小程序
定价
高级版会员购买积分包购买API积分包
服务
文献检索文档翻译深度研究API 文档MCP 服务
关于我们
关于 Suppr公司介绍联系我们用户协议隐私条款
关注我们

Suppr 超能文献

核心技术专利:CN118964589B侵权必究
粤ICP备2023148730 号-1Suppr @ 2026

文献检索

告别复杂PubMed语法,用中文像聊天一样搜索,搜遍4000万医学文献。AI智能推荐,让科研检索更轻松。

立即免费搜索

文件翻译

保留排版,准确专业,支持PDF/Word/PPT等文件格式,支持 12+语言互译。

免费翻译文档

深度研究

AI帮你快速写综述,25分钟生成高质量综述,智能提取关键信息,辅助科研写作。

立即免费体验

人工不透水表面的全球分布与密度

Global Distribution and Density of Constructed Impervious Surfaces.

作者信息

Elvidge Christopher D, Tuttle Benjamin T, Sutton Paul C, Baugh Kimberly E, Howard Ara T, Milesi Cristina, Bhaduri Budhendra, Nemani Ramakrishna

机构信息

Earth Observation Group, NOAA National Geophysical Data Center, 325 Broadway, Boulder, Colorado 80305, USA.

Cooperative Institute for Research in the Environmental Sciences University of Colorado, Boulder, Colorado, USA.

出版信息

Sensors (Basel). 2007 Sep 21;7(9):1962-1979. doi: 10.3390/s7091962.

DOI:10.3390/s7091962
PMID:28903208
原文链接:https://pmc.ncbi.nlm.nih.gov/articles/PMC3841857/
Abstract

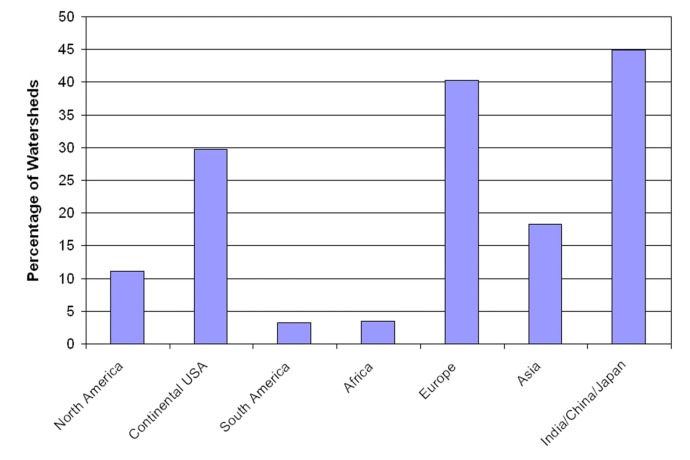
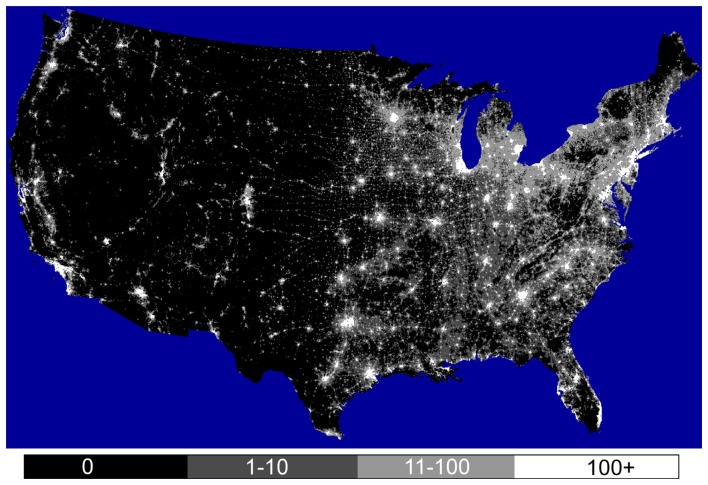
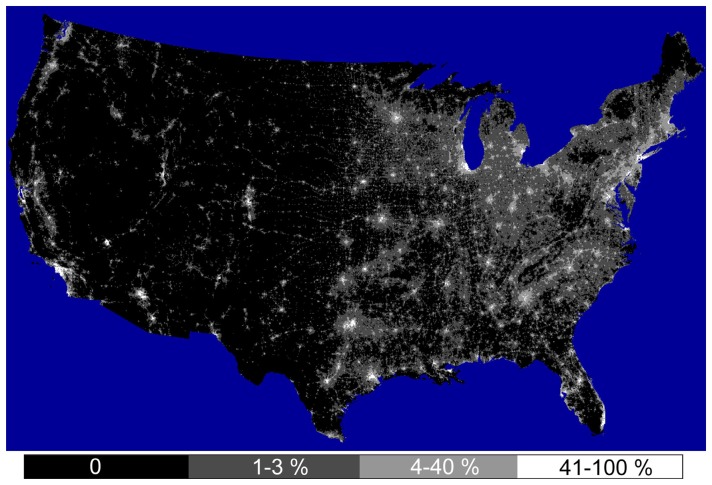
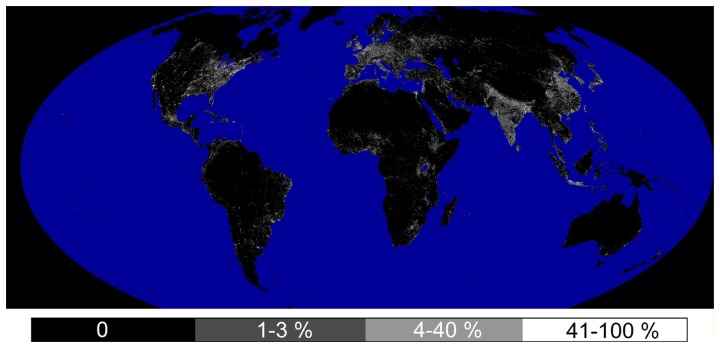
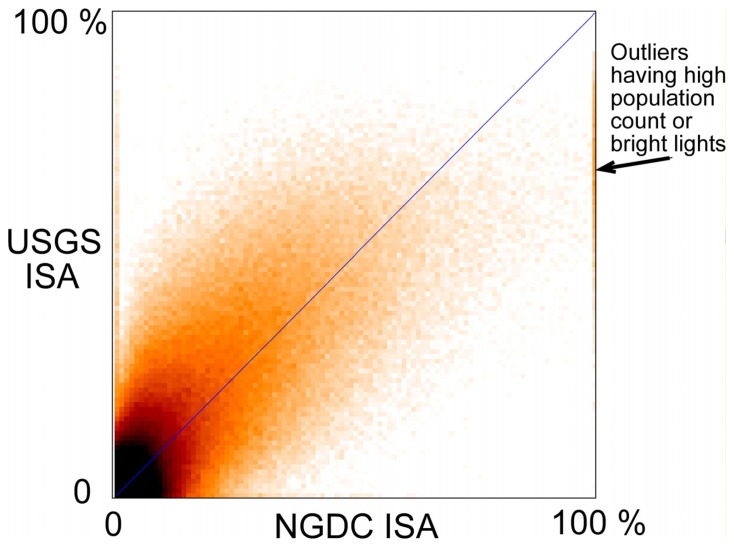
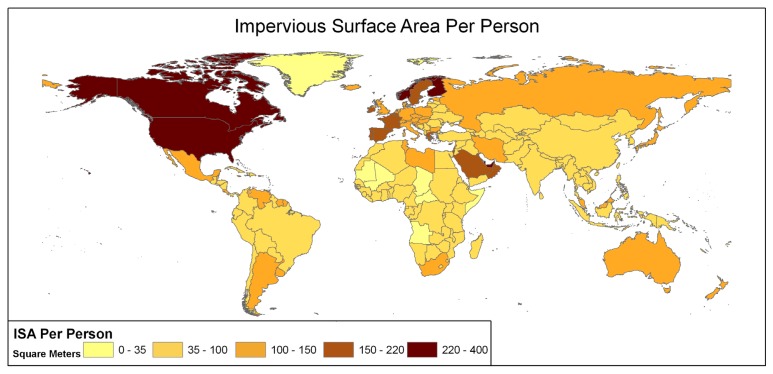
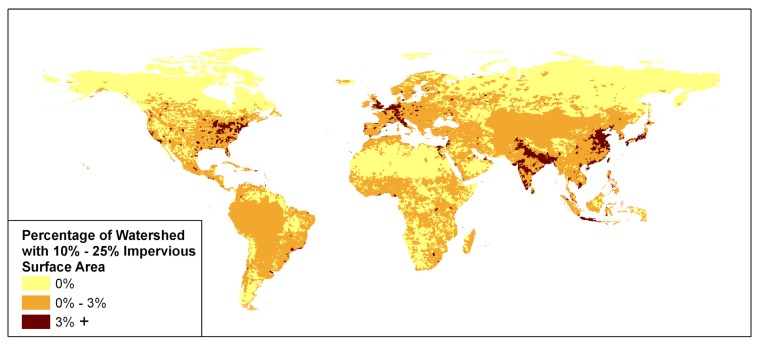
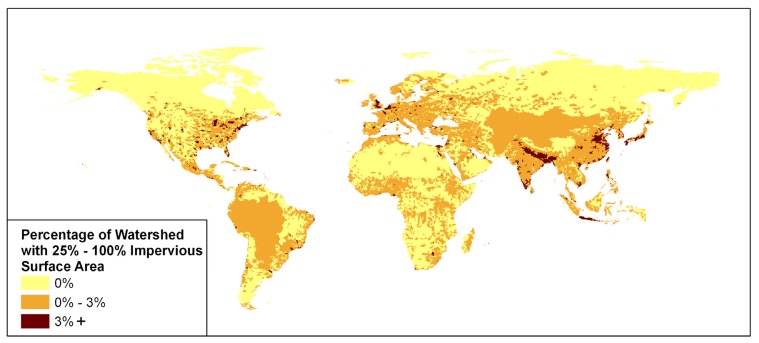
We present the first global inventory of the spatial distribution and density ofconstructed impervious surface area (ISA). Examples of ISA include roads, parking lots,buildings, driveways, sidewalks and other manmade surfaces. While high spatialresolution is required to observe these features, the new product reports the estimateddensity of ISA on a one-km² grid based on two coarse resolution indicators of ISA - thebrightness of satellite observed nighttime lights and population count. The model wascalibrated using 30-meter resolution ISA of the USA from the U.S. Geological Survey.Nominally the product is for the years 2000-01 since both the nighttime lights andreference data are from those two years. We found that 1.05% of the United States landarea is impervious surface (83,337 km²) and 0.43 % of the world's land surface (579,703km²) is constructed impervious surface. China has more ISA than any other country(87,182 km²), but has only 67 m² of ISA per person, compared to 297 m² per person in theUSA. The distribution of ISA in the world's primary drainage basins indicates that watersheds damaged by ISA are primarily concentrated in the USA, Europe, Japan, China and India. The authors believe the next step for improving the product is to include reference ISA data from many more areas around the world.

摘要

我们展示了首个关于人造不透水表面积(ISA)空间分布和密度的全球清单。ISA的例子包括道路、停车场、建筑物、车道、人行道及其他人造表面。虽然观测这些特征需要高空间分辨率,但该新产品基于两个ISA的粗分辨率指标——卫星观测到的夜间灯光亮度和人口数量,报告了每平方公里网格上ISA的估计密度。该模型使用了美国地质调查局提供的美国30米分辨率的ISA进行校准。名义上,该产品适用于2000 - 2001年,因为夜间灯光和参考数据均来自这两年。我们发现,美国陆地面积的1.05%是不透水表面(83,337平方公里),世界陆地表面的0.43%是人造不透水表面(579,703平方公里)。中国的ISA比其他任何国家都多(87,182平方公里),但人均ISA只有67平方米,而美国人均为297平方米。世界主要流域的ISA分布表明,受ISA破坏的流域主要集中在美国、欧洲、日本、中国和印度。作者认为改进该产品的下一步是纳入来自世界更多地区的参考ISA数据。

https://cdn.ncbi.nlm.nih.gov/pmc/blobs/8aff/3841857/bb39c85d88a4/sensors-07-01962f13.jpg
https://cdn.ncbi.nlm.nih.gov/pmc/blobs/8aff/3841857/fb96f0a12e41/sensors-07-01962f1.jpg
https://cdn.ncbi.nlm.nih.gov/pmc/blobs/8aff/3841857/a331a7b53432/sensors-07-01962f2.jpg
https://cdn.ncbi.nlm.nih.gov/pmc/blobs/8aff/3841857/162d75f5eebd/sensors-07-01962f3.jpg
https://cdn.ncbi.nlm.nih.gov/pmc/blobs/8aff/3841857/1c93cd686eb1/sensors-07-01962f4.jpg
https://cdn.ncbi.nlm.nih.gov/pmc/blobs/8aff/3841857/38e595b5b96e/sensors-07-01962f5.jpg
https://cdn.ncbi.nlm.nih.gov/pmc/blobs/8aff/3841857/db391b26bcb1/sensors-07-01962f6.jpg
https://cdn.ncbi.nlm.nih.gov/pmc/blobs/8aff/3841857/bf127b1404ae/sensors-07-01962f7.jpg
https://cdn.ncbi.nlm.nih.gov/pmc/blobs/8aff/3841857/1197f23d1630/sensors-07-01962f8.jpg
https://cdn.ncbi.nlm.nih.gov/pmc/blobs/8aff/3841857/8f8691bbbf31/sensors-07-01962f9.jpg
https://cdn.ncbi.nlm.nih.gov/pmc/blobs/8aff/3841857/d5a4187b27b0/sensors-07-01962f10.jpg
https://cdn.ncbi.nlm.nih.gov/pmc/blobs/8aff/3841857/b977f2fac349/sensors-07-01962f11.jpg
https://cdn.ncbi.nlm.nih.gov/pmc/blobs/8aff/3841857/3af0f88c18b3/sensors-07-01962f12.jpg
https://cdn.ncbi.nlm.nih.gov/pmc/blobs/8aff/3841857/bb39c85d88a4/sensors-07-01962f13.jpg

相似文献

1
Global Distribution and Density of Constructed Impervious Surfaces.人工不透水表面的全球分布与密度
Sensors (Basel). 2007 Sep 21;7(9):1962-1979. doi: 10.3390/s7091962.
2
Quantifying the response of potential flooding risk to urban growth in Beijing.量化北京潜在洪水风险对城市发展的响应。
Sci Total Environ. 2020 Feb 25;705:135868. doi: 10.1016/j.scitotenv.2019.135868. Epub 2019 Dec 2.
3
Evaluation of the Health Status of Indonesian Watersheds Using Impervious Surface Area as an Indicator.利用不透水面面积评估印度尼西亚流域的健康状况。
Sensors (Basel). 2023 May 22;23(10):4975. doi: 10.3390/s23104975.
4
Associations between Greenness, Impervious Surface Area, and Nighttime Lights on Biomarkers of Vascular Aging in Chennai, India.印度钦奈地区绿地、不透水表面积和夜间灯光与血管老化生物标志物之间的关联。
Environ Health Perspect. 2017 Aug 2;125(8):087003. doi: 10.1289/EHP541.
5
Analysis of changes in the spatiotemporal characteristics of impervious surfaces and their influencing factors in the Central Plains Urban Agglomeration of China from 2000 to 2018.2000年至2018年中国中原城市群不透水表面时空特征变化及其影响因素分析
Heliyon. 2023 Aug 1;9(8):e18849. doi: 10.1016/j.heliyon.2023.e18849. eCollection 2023 Aug.
6
40-Year (1978-2017) human settlement changes in China reflected by impervious surfaces from satellite remote sensing.基于卫星遥感不透水面反映的中国40年(1978 - 2017年)人类聚居地变化
Sci Bull (Beijing). 2019 Jun 15;64(11):756-763. doi: 10.1016/j.scib.2019.04.024. Epub 2019 Apr 18.
7
Landsat-derived impervious surface area expansion in the Arctic from 1985 to 2021.1985年至2021年北极地区陆地卫星数据显示的不透水表面面积扩张情况。
Sci Total Environ. 2023 Dec 20;905:166966. doi: 10.1016/j.scitotenv.2023.166966. Epub 2023 Sep 17.
8
Mapping impervious surface area in the Brazilian Amazon using Landsat Imagery.利用陆地卫星影像绘制巴西亚马逊地区的不透水表面积。
GIsci Remote Sens. 2013;50(2):172-183. doi: 10.1080/15481603.2013.780452.
9
Impacts of impervious surface expansion on soil organic carbon--a spatially explicit study.不透水表面扩张对土壤有机碳的影响——一项空间明确的研究。
Sci Rep. 2015 Dec 8;5:17905. doi: 10.1038/srep17905.
10
Extraction of High-Precision Urban Impervious Surfaces from Sentinel-2 Multispectral Imagery via Modified Linear Spectral Mixture Analysis.基于改进线性光谱混合分析的 Sentinel-2 多光谱影像高精度城市不透水面提取。
Sensors (Basel). 2018 Aug 31;18(9):2873. doi: 10.3390/s18092873.

引用本文的文献

1
Annual Impervious Surface Data from 2001-2020 for West African Countries: Ghana, Togo, Benin and Nigeria.2001年至2020年西非国家(加纳、多哥、贝宁和尼日利亚)的年度不透水表面数据。
Sci Data. 2024 Jul 18;11(1):791. doi: 10.1038/s41597-024-03610-8.
2
The Anthropogenic Salt Cycle.人为盐循环
Nat Rev Earth Environ. 2023 Oct 31;4:770-784. doi: 10.1038/s43017-023-00485-y.
3
Evaluation of the Health Status of Indonesian Watersheds Using Impervious Surface Area as an Indicator.利用不透水面面积评估印度尼西亚流域的健康状况。

本文引用的文献

1
From wealth to health: modelling the distribution of income per capita at the sub-national level using night-time light imagery.从财富到健康:利用夜间灯光图像模拟国家以下层面的人均收入分布
Int J Health Geogr. 2005 Feb 10;4(1):5. doi: 10.1186/1476-072X-4-5.
Sensors (Basel). 2023 May 22;23(10):4975. doi: 10.3390/s23104975.
4
A global urban microwave backscatter time series data set for 1993-2020 using ERS, QuikSCAT, and ASCAT data.利用 ERS、QuikSCAT 和 ASCAT 数据生成的 1993-2020 年全球城市微波后向散射时间序列数据集。
Sci Data. 2022 Mar 16;9(1):88. doi: 10.1038/s41597-022-01193-w.
5
Spatiotemporal evolution of COVID-19 infection and detection within night light networks: comparative analysis of USA and China.夜光网络中新冠病毒感染与检测的时空演变:美国与中国的比较分析
Appl Netw Sci. 2021;6(1):10. doi: 10.1007/s41109-020-00345-4. Epub 2021 Feb 11.
6
Evidence for the evolution of thermal tolerance, but not desiccation tolerance, in response to hotter, drier city conditions in a cosmopolitan, terrestrial isopod.在一种分布广泛的陆生等足动物中,有证据表明其耐热性发生了进化,以应对城市中更炎热、干燥的环境,但耐干性并未进化。
Evol Appl. 2020 Aug 19;14(1):12-23. doi: 10.1111/eva.13052. eCollection 2021 Jan.
7
Outlook from the soil perspective of urban expansion and food security.从土壤视角看城市扩张与粮食安全
Heliyon. 2021 Jan 9;7(1):e05860. doi: 10.1016/j.heliyon.2020.e05860. eCollection 2021 Jan.
8
Detection of County Economic Development Using LJ1-01 Nighttime Light Imagery: A Comparison with NPP-VIIRS Data.利用 LJ1-01 夜间灯光图像检测县域经济发展:与 NPP-VIIRS 数据的比较。
Sensors (Basel). 2020 Nov 19;20(22):6633. doi: 10.3390/s20226633.
9
A POI and LST Adjusted NTL Urban Index for Urban Built-Up Area Extraction.一种用于城市建成区提取的经兴趣点(POI)和局部标准差(LST)调整的归一化植被指数(NTL)城市指数
Sensors (Basel). 2020 May 21;20(10):2918. doi: 10.3390/s20102918.
10
The effect of local species composition on the distribution of an avian invader.本地物种组成对鸟类入侵种分布的影响。
Sci Rep. 2019 Nov 1;9(1):15861. doi: 10.1038/s41598-019-52256-9.