Hinzpeter Ricarda, Wagner Matthias W, Wurnig Moritz C, Seifert Burkhardt, Manka Robert, Alkadhi Hatem
Institute of Diagnostic and Interventional Radiology, University Hospital Zurich, University of Zurich, Zurich, Switzerland.
Epidemiology, Biostatistics and Prevention Institute, University of Zurich, Zurich, Switzerland.
PLoS One. 2017 Nov 2;12(11):e0186876. doi: 10.1371/journal.pone.0186876. eCollection 2017.
To investigate the feasibility and accuracy of texture analysis to distinguish through objective and quantitative image information between healthy and infarcted myocardium with computed tomography (CT).
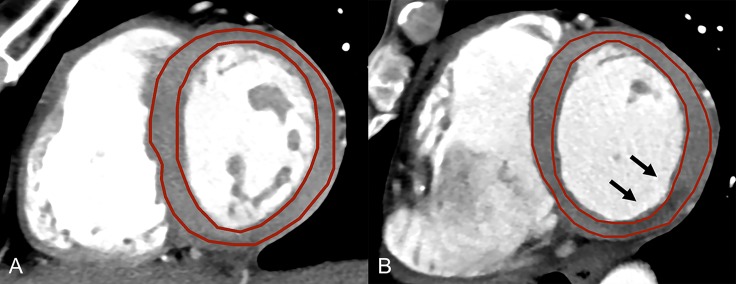
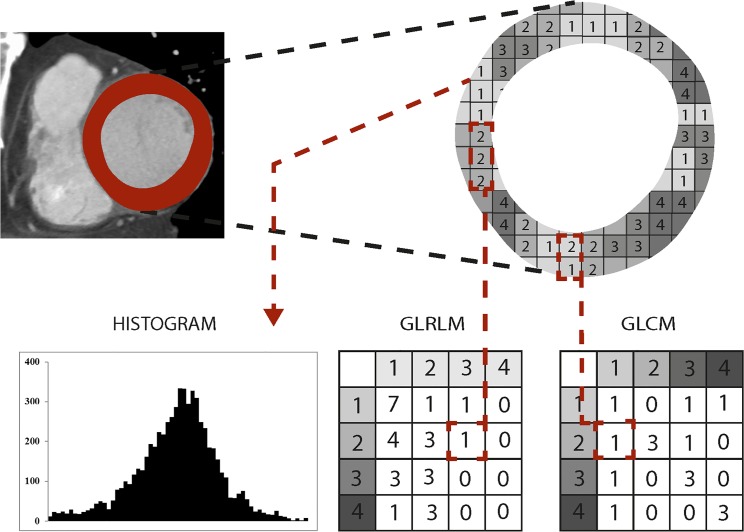
Twenty patients (5 females; mean age 56±10years) with proven acute myocardial infarction (MI) and 20 patients (8 females; mean age 42±15years) with no cardiac abnormalities (hereafter termed controls) underwent contrast-enhanced cardiac CT. Short axis CT images of the left ventricle (LV) were reconstructed at the slice thicknesses 1mm, 2mm, and 5mm. Two independent, blinded readers segmented the LV in controls and patients. Texture analysis was performed yielding first-level features based on the histogram (variance, skewness, kurtosis, entropy), second-level features based on the gray-level co-occurrence matrix (GLCM) (contrast, correlation, energy and homogeneity), and third-level features based on the gray-level run-length matrix (GLRLM).
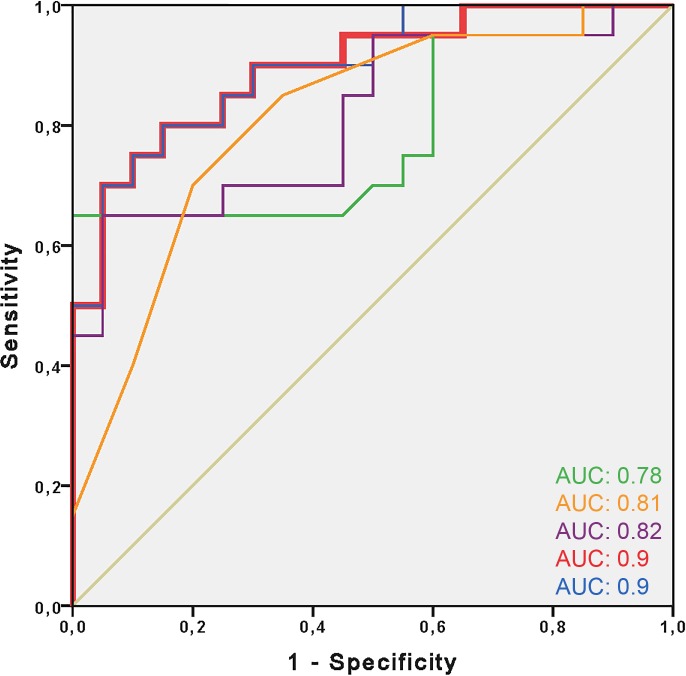
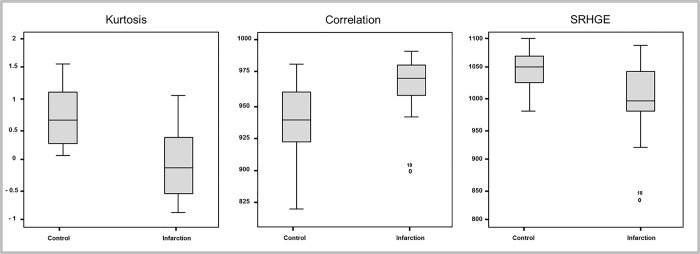
Inter-and intrareader agreement was good to excellent for all histogram (intraclass correlation coefficient (ICC):0.70-0.93) and for all GLCM features (ICC:0.66-0.99), and was variable for the GLRLM features (ICC:-0.12-0.99). Univariate analysis showed significant differences between patients and controls for 2/4 histogram features, 3/4 GLCM and for 6/11 GLRLM features and all assessed slice thicknesses (all,p<0.05). In a multivariate logistic regression model, the single best variable from each level, determined by ROC analysis, was included stepwise. The best model included kurtosis (OR 0.08, 95%CI:0.01-0.65,P = 0.018) and short run high gray-level emphasis (SRHGE, OR 0.97, 95%CI:0.94-0.99,P = 0.007), with an area-under-the-curve (AUC) of 0.90 (95%CI:0.80-0.99). The best results for kurtosis and SRHGE (AUC = 0.78) were obtained at a 5mm slice thickness. A cut-off value of 14.4 for kurtosis+0.013*SRHGE predicted acute MI with a sensitivity of 95% (specificity 55%).
Our study illustrates the feasibility of texture analysis for distinguishing healthy from acutely infarcted myocardium with cardiac CT using objective, quantitative features, with most reproducible and accurate results at a short axis slice thickness of 5mm.
通过计算机断层扫描(CT)的客观和定量图像信息,研究纹理分析区分健康心肌和梗死心肌的可行性和准确性。
20例经证实的急性心肌梗死(MI)患者(5例女性;平均年龄56±10岁)和20例无心脏异常的患者(以下称为对照组,8例女性;平均年龄42±15岁)接受了对比增强心脏CT检查。以1mm、2mm和5mm的层厚重建左心室(LV)的短轴CT图像。两名独立的、不知情的阅片者对对照组和患者的LV进行分割。进行纹理分析,得出基于直方图的一级特征(方差、偏度、峰度、熵)、基于灰度共生矩阵(GLCM)的二级特征(对比度、相关性、能量和同质性)以及基于灰度游程长度矩阵(GLRLM)的三级特征。
所有直方图特征(组内相关系数(ICC):0.70 - 0.93)和所有GLCM特征(ICC:0.66 - 0.99)的阅片者间和阅片者内一致性良好至优秀,而GLRLM特征的一致性则有所不同(ICC:-0.12 - 0.99)。单因素分析显示,患者与对照组之间在2/4个直方图特征、3/4个GLCM特征以及6/11个GLRLM特征和所有评估的层厚上存在显著差异(均P<0.05)。在多因素逻辑回归模型中,通过ROC分析确定的每个水平的最佳单一变量逐步纳入。最佳模型包括峰度(OR 0.08,95%CI:0.01 - 0.65,P = 0.018)和短游程高灰度级强调(SRHGE,OR 0.97,95%CI:0.94 - 0.99,P = 0.007),曲线下面积(AUC)为0.90(95%CI:0.80 - 0.99)。在5mm层厚时,峰度和SRHGE的最佳结果(AUC = 0.78)。峰度+0.013*SRHGE的截断值为14.4时,预测急性心肌梗死的敏感性为95%(特异性为55%)。
我们的研究表明,使用心脏CT通过客观、定量特征进行纹理分析以区分健康心肌和急性梗死心肌具有可行性,在短轴层厚为5mm时结果最具可重复性和准确性。