Division of Pharmaceutical Analysis, Office of Testing and Research, Office of Pharmaceutical Quality, Center for Drug Evaluation and Research, US Food and Drug Administration, Silver Spring, Maryland, 20993, USA.
Department of Mathematics and Statistics, University of Maryland Baltimore County, Baltimore, Maryland, 21250, USA.
AAPS PharmSciTech. 2018 Apr;19(3):1011-1019. doi: 10.1208/s12249-017-0911-1. Epub 2017 Nov 6.
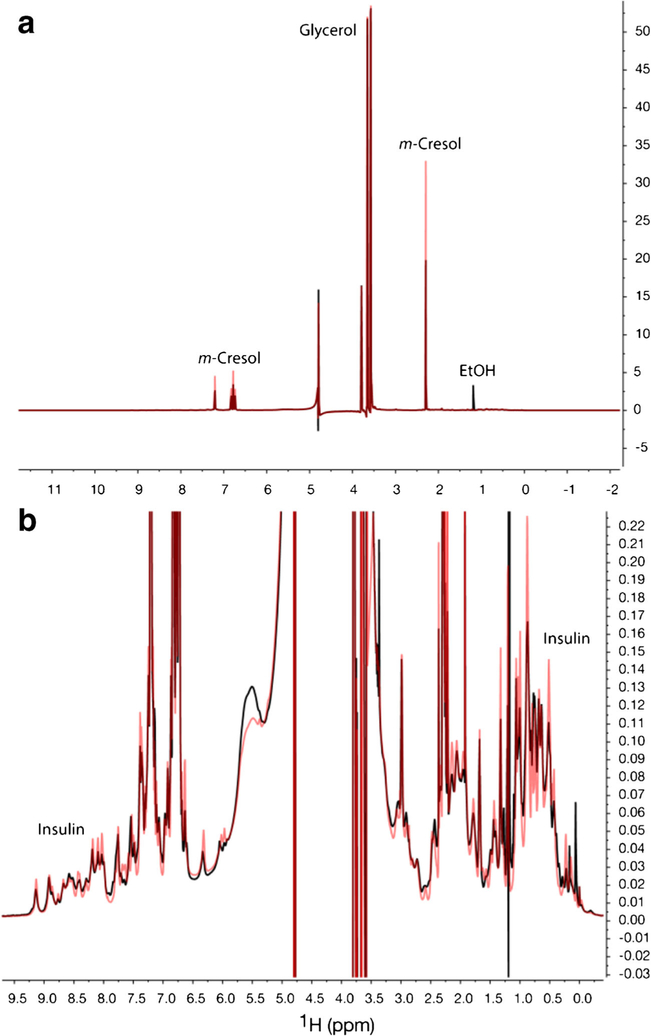
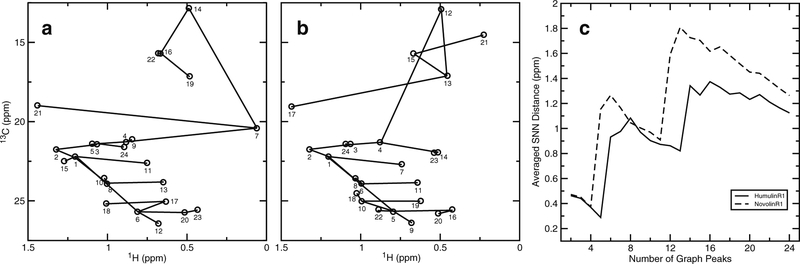
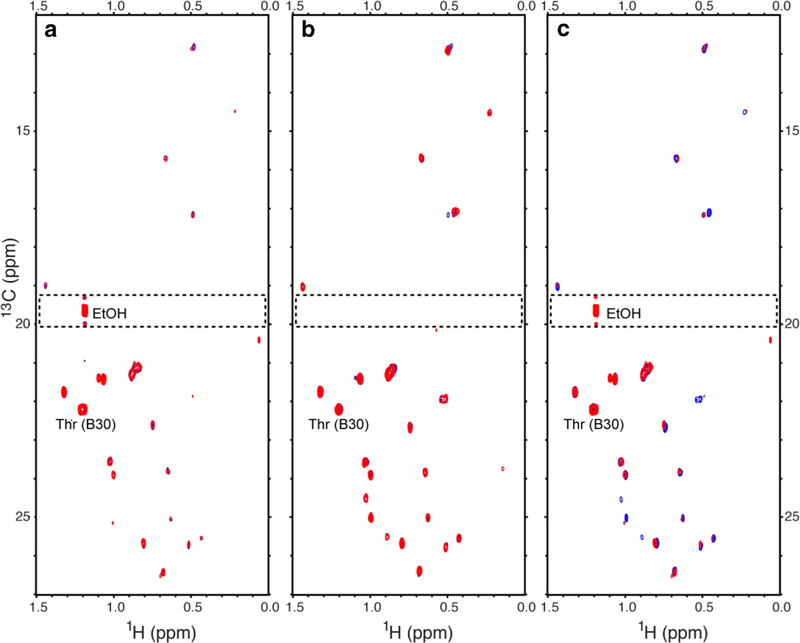
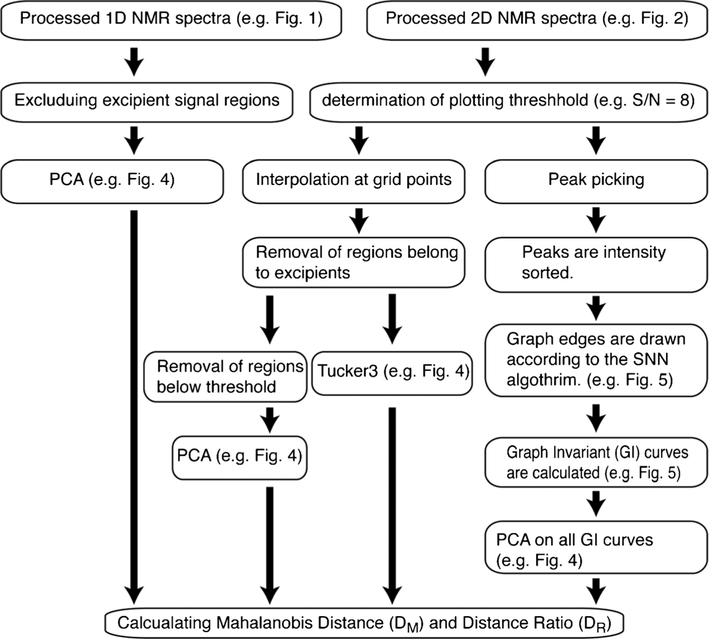
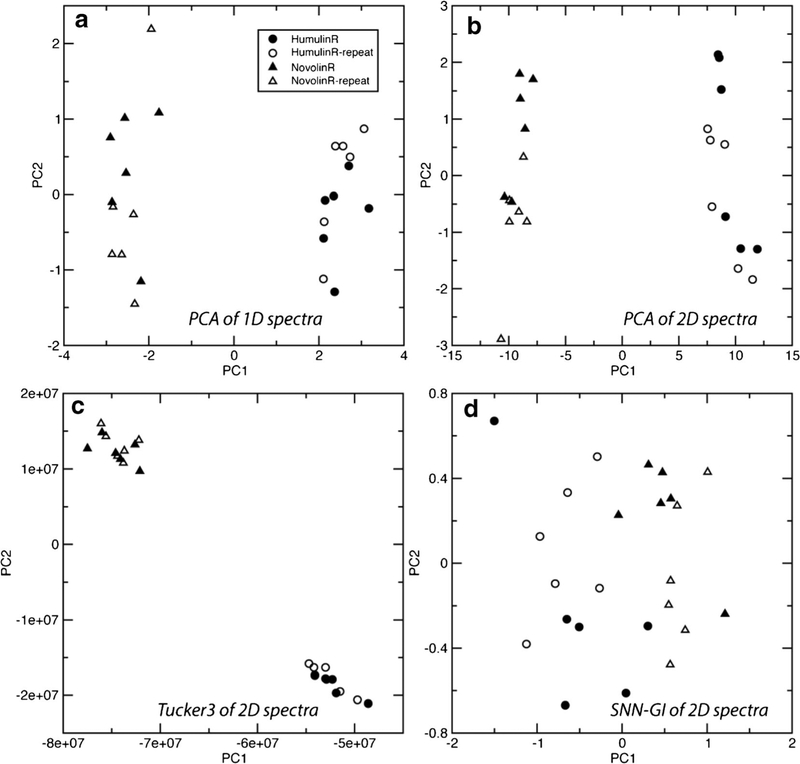
NMR spectroscopy is an emerging analytical tool for measuring complex drug product qualities, e.g., protein higher order structure (HOS) or heparin chemical composition. Most drug NMR spectra have been visually analyzed; however, NMR spectra are inherently quantitative and multivariate and thus suitable for chemometric analysis. Therefore, quantitative measurements derived from chemometric comparisons between spectra could be a key step in establishing acceptance criteria for a new generic drug or a new batch after manufacture change. To measure the capability of chemometric methods to differentiate comparator NMR spectra, we calculated inter-spectra difference metrics on 1D/2D spectra of two insulin drugs, Humulin R® and Novolin R®, from different manufacturers. Both insulin drugs have an identical drug substance but differ in formulation. Chemometric methods (i.e., principal component analysis (PCA), 3-way Tucker3 or graph invariant (GI)) were performed to calculate Mahalanobis distance (D ) between the two brands (inter-brand) and distance ratio (D ) among the different lots (intra-brand). The PCA on 1D inter-brand spectral comparison yielded a D value of 213. In comparing 2D spectra, the Tucker3 analysis yielded the highest differentiability value (D = 305) in the comparisons made followed by PCA (D = 255) then the GI method (D = 40). In conclusion, drug quality comparisons among different lots might benefit from PCA on 1D spectra for rapidly comparing many samples, while higher resolution but more time-consuming 2D-NMR-data-based comparisons using Tucker3 analysis or PCA provide a greater level of assurance for drug structural similarity evaluation between drug brands.
NMR 光谱学是一种新兴的分析工具,可用于测量复杂的药物产品质量,例如蛋白质高级结构(HOS)或肝素化学组成。大多数药物 NMR 光谱已经过目视分析;然而,NMR 光谱本质上是定量的和多变量的,因此适合化学计量学分析。因此,从光谱之间的化学计量比较得出的定量测量可能是建立新仿制药或制造变更后新产品批次接受标准的关键步骤。为了衡量化学计量方法区分比较器 NMR 光谱的能力,我们计算了来自不同制造商的两种胰岛素药物 Humulin R®和 Novolin R®的 1D/2D 光谱之间的光谱间差异度量。这两种胰岛素药物具有相同的药物物质,但在配方上有所不同。进行了化学计量方法(即主成分分析(PCA)、3 向 Tucker3 或图不变量(GI))以计算两个品牌(品牌间)之间的马氏距离(D)和不同批次(品牌内)之间的距离比(D)。1D 品牌间光谱比较的 PCA 产生了 213 的 D 值。在比较 2D 光谱时,Tucker3 分析在随后进行的比较中产生了最高的可区分性值(D = 305),其次是 PCA(D = 255),然后是 GI 方法(D = 40)。总之,不同批次之间的药物质量比较可能受益于 1D 光谱上的 PCA,以便快速比较许多样本,而使用 Tucker3 分析或 PCA 的更高分辨率但更耗时的 2D-NMR 数据基比较则为药物品牌之间的药物结构相似性评估提供了更大的保证。