Obermeyer Ziad, Samra Jasmeet K, Mullainathan Sendhil
Department of Emergency Medicine, Brigham and Women's Hospital, Boston, MA, USA
Department of Emergency Medicine and Health Care Policy, Harvard Medical School, Boston, MA, USA.
BMJ. 2017 Dec 13;359:j5468. doi: 10.1136/bmj.j5468.
To estimate individual level body temperature and to correlate it with other measures of physiology and health.
Observational cohort study.
Outpatient clinics of a large academic hospital, 2009-14.
35 488 patients who neither received a diagnosis for infections nor were prescribed antibiotics, in whom temperature was expected to be within normal limits.
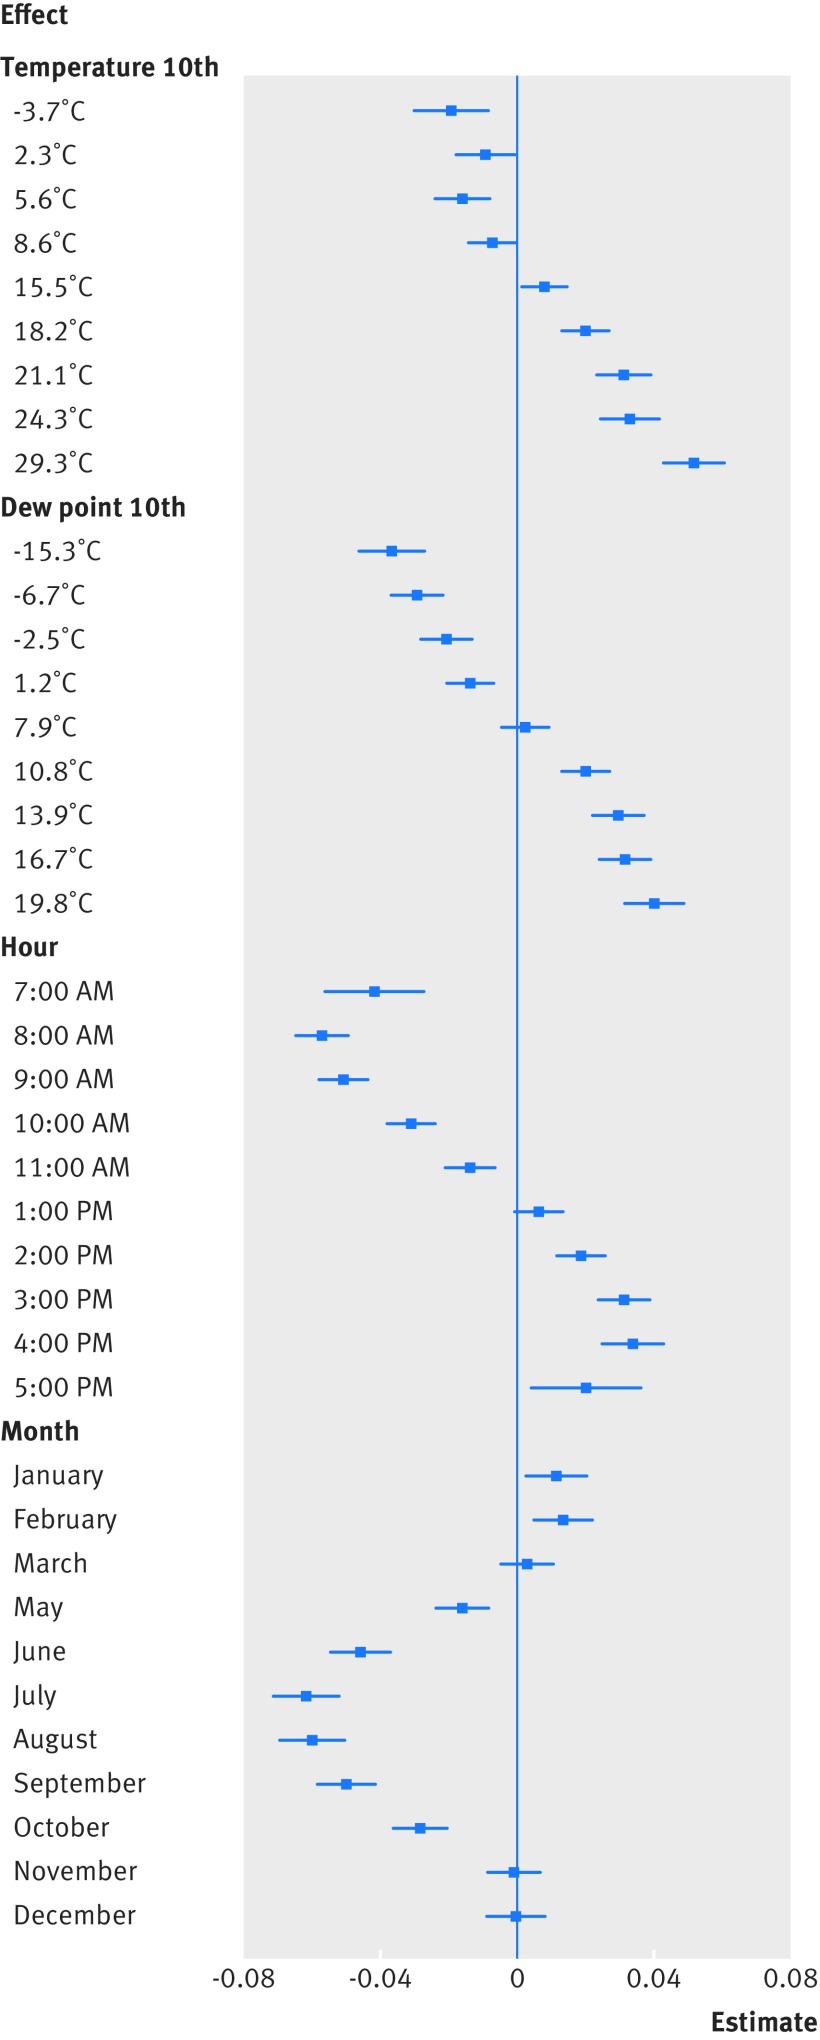
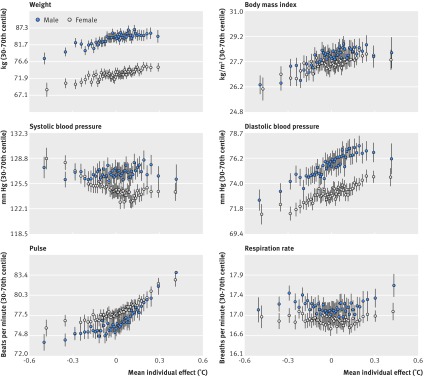
Baseline temperatures at individual level, estimated using random effects regression and controlling for ambient conditions at the time of measurement, body site, and time factors. Baseline temperatures were correlated with demographics, medical comorbidities, vital signs, and subsequent one year mortality.
In a diverse cohort of 35 488 patients (mean age 52.9 years, 64% women, 41% non-white race) with 243 506 temperature measurements, mean temperature was 36.6°C (95% range 35.7-37.3°C, 99% range 35.3-37.7°C). Several demographic factors were linked to individual level temperature, with older people the coolest (-0.021°C for every decade, P<0.001) and African-American women the hottest (versus white men: 0.052°C, P<0.001). Several comorbidities were linked to lower temperature (eg, hypothyroidism: -0.013°C, P=0.01) or higher temperature (eg, cancer: 0.020, P<0.001), as were physiological measurements (eg, body mass index: 0.002 per m/kg, P<0.001). Overall, measured factors collectively explained only 8.2% of individual temperature variation. Despite this, unexplained temperature variation was a significant predictor of subsequent mortality: controlling for all measured factors, an increase of 0.149°C (1 SD of individual temperature in the data) was linked to 8.4% higher one year mortality (P=0.014).
Individuals' baseline temperatures showed meaningful variation that was not due solely to measurement error or environmental factors. Baseline temperatures correlated with demographics, comorbid conditions, and physiology, but these factors explained only a small part of individual temperature variation. Unexplained variation in baseline temperature, however, strongly predicted mortality.
估计个体体温,并将其与其他生理和健康指标相关联。
观察性队列研究。
一家大型学术医院的门诊诊所,2009 - 2014年。
35488名既未被诊断为感染也未被开具抗生素处方的患者,预计其体温在正常范围内。
个体水平的基线体温,采用随机效应回归估计,并控制测量时的环境条件、身体部位和时间因素。基线体温与人口统计学特征、合并症、生命体征以及随后一年的死亡率相关。
在一个包含35488名患者(平均年龄52.9岁,64%为女性,41%为非白人种族)的多样化队列中,进行了243506次体温测量,平均体温为36.6°C(95%范围为35.7 - 37.3°C,99%范围为35.3 - 37.7°C)。几个人口统计学因素与个体水平的体温相关,老年人体温最低(每十年降低0.021°C,P<0.001),非裔美国女性体温最高(与白人男性相比:高0.052°C,P<0.001)。几种合并症与较低体温(如甲状腺功能减退:-0.013°C,P = 0.01)或较高体温(如癌症:0.020,P<0.001)相关,生理测量指标(如体重指数:每m²/kg为0.002,P<0.001)也是如此。总体而言,所测量的因素共同仅解释了个体体温变化的8.2%。尽管如此,无法解释的体温变化是随后死亡率的一个重要预测因素:在控制所有测量因素后,体温升高0.149°C(数据中个体体温的1个标准差)与一年死亡率升高8.4%相关(P = 0.014)。
个体的基线体温显示出有意义的变化,这并非仅由测量误差或环境因素导致。基线体温与人口统计学特征、合并症情况和生理指标相关,但这些因素仅解释了个体体温变化的一小部分。然而,基线体温中无法解释的变化强烈预测了死亡率。