• 文献检索
  • 文档翻译
  • 深度研究
  • 学术资讯
  • Suppr Zotero 插件Zotero 插件
  • 邀请有礼
  • 套餐&价格
  • 历史记录
应用&插件
Suppr Zotero 插件Zotero 插件浏览器插件Mac 客户端Windows 客户端微信小程序
定价
高级版会员购买积分包购买API积分包
服务
文献检索文档翻译深度研究API 文档MCP 服务
关于我们
关于 Suppr公司介绍联系我们用户协议隐私条款
关注我们

Suppr 超能文献

核心技术专利:CN118964589B侵权必究
粤ICP备2023148730 号-1Suppr @ 2026

文献检索

告别复杂PubMed语法,用中文像聊天一样搜索,搜遍4000万医学文献。AI智能推荐,让科研检索更轻松。

立即免费搜索

文件翻译

保留排版,准确专业,支持PDF/Word/PPT等文件格式,支持 12+语言互译。

免费翻译文档

深度研究

AI帮你快速写综述,25分钟生成高质量综述,智能提取关键信息,辅助科研写作。

立即免费体验

利用统一的国家统计数据和清查样地对欧洲森林生物量地图进行评估。

An assessment of forest biomass maps in Europe using harmonized national statistics and inventory plots.

作者信息

Avitabile Valerio, Camia Andrea

机构信息

European Commission, Joint Research Centre, Via E. Fermi 2749, 21027 Ispra, Italy.

出版信息

For Ecol Manage. 2018 Feb 1;409:489-498. doi: 10.1016/j.foreco.2017.11.047.

DOI:10.1016/j.foreco.2017.11.047
PMID:29449758
原文链接:https://pmc.ncbi.nlm.nih.gov/articles/PMC5806600/
Abstract

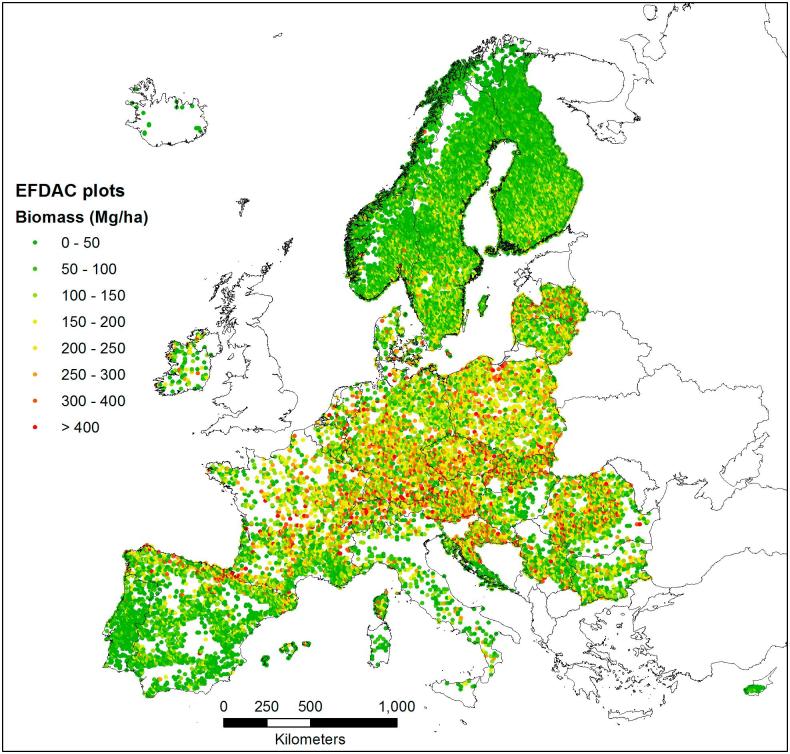
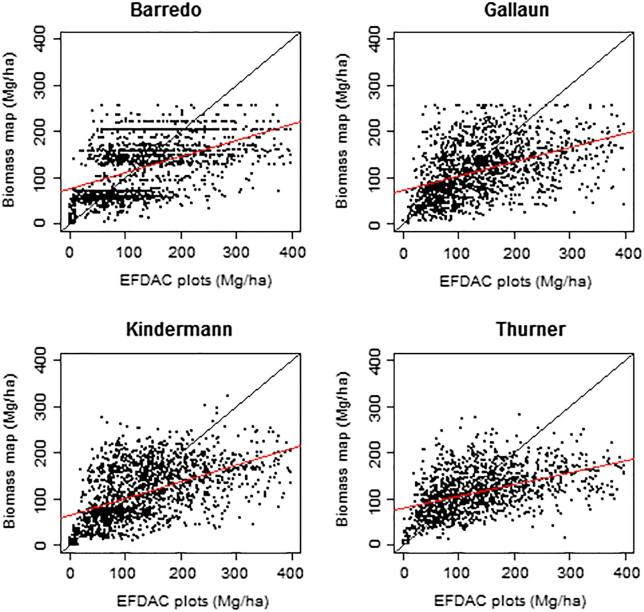
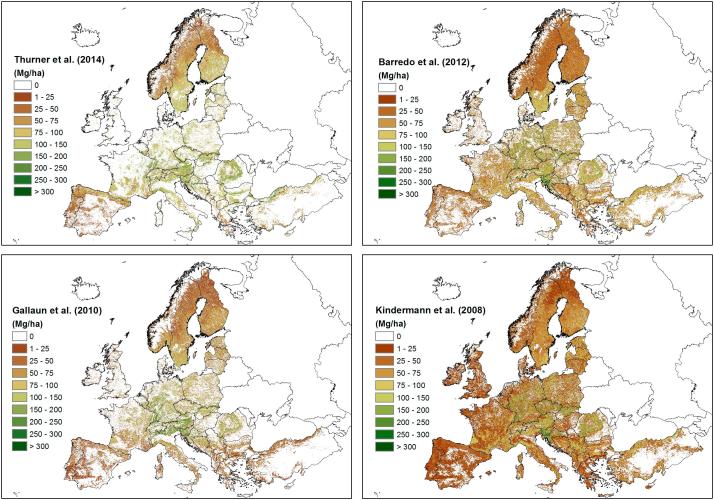
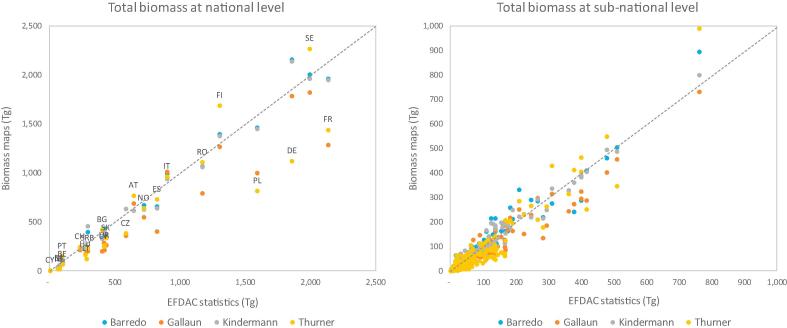
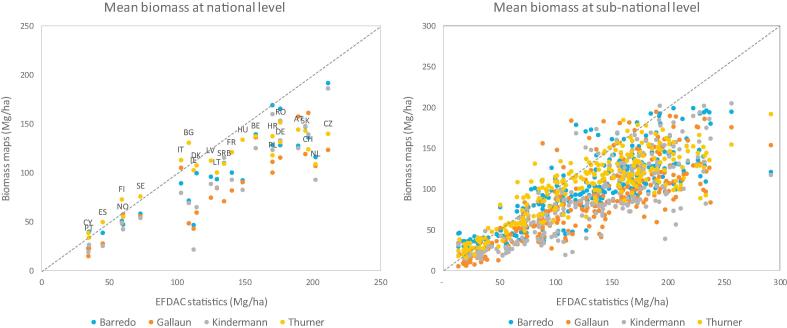
Maps of aboveground forest biomass based on different input data and modelling approaches have been recently produced for Europe, opening up the possibility for several applications and products not obtainable by summary statistics. However, the accuracy assessment of the existing maps is limited by the lack of reference data consistent over the study region and representative of the maps cells. Here, we used harmonized forest biomass data for 26 European countries derived by National Forest Inventories using a common biomass definition and estimator to assess four biomass maps. The assessment was performed at regional, national and sub-national scales using harmonized statistics derived from almost half million ground plot measurements, and at pixel level using a subset of 22,166 plots covering most European forest types. The field plots were temporally aligned with the maps using growth rates and further screened using an innovative approach based on tree cover variability to remove the plots not representative of the map cells. The harmonized reference data showed that all maps tended to overestimate at low biomass (<100 Mg ha) and underestimate at medium - high biomass (>100 Mg ha), resulting in an overall negative bias (23-43 Mg ha at national level) relative to the harmonized estimates. The maps relative errors ranged from 29% to 40% at national level and increased at higher resolutions, reaching 58-67% at pixel level. We also assessed the effect of the harmonization of the national statistics and report that the harmonized biomass values present significant differences compared to the national estimates for 14 countries, and provide a slightly higher stock (+3.8%) at European scale. We show that harmonized and representative reference data are essential to properly assess the accuracy of biomass maps, and we further identify the factors affecting the maps performance and provide indications for their improvements.

摘要

近期基于不同输入数据和建模方法制作了欧洲的地上森林生物量地图,为一些无法通过汇总统计获得的应用和产品开辟了可能性。然而,现有地图的精度评估受到研究区域内缺乏一致且能代表地图单元的参考数据的限制。在此,我们使用了由国家森林清查得出的26个欧洲国家的统一森林生物量数据,这些数据采用了共同的生物量定义和估算器来评估四张生物量地图。评估在区域、国家和次国家尺度上进行,使用了源自近50万个地面样地测量数据的统一统计数据,并在像素级别使用了涵盖大多数欧洲森林类型的22,166个样地的子集。利用生长率使实地样地在时间上与地图对齐,并基于树木覆盖变异性采用创新方法进一步筛选,以去除不能代表地图单元的样地。统一的参考数据表明,所有地图在低生物量(<100 Mg ha)时往往高估,在中高生物量(>100 Mg ha)时往往低估,相对于统一估算值,总体呈现负偏差(国家层面为23 - 43 Mg ha)。地图的相对误差在国家层面为29%至40%,在更高分辨率下会增加,在像素级别达到58 - 67%。我们还评估了国家统计数据统一的影响,并报告称,统一的生物量值与14个国家的国家估算值相比存在显著差异,在欧洲尺度上提供了略高的储量(+3.8%)。我们表明,统一且具有代表性的参考数据对于正确评估生物量地图的精度至关重要,并且我们进一步识别了影响地图性能的因素并为其改进提供了指示。

https://cdn.ncbi.nlm.nih.gov/pmc/blobs/2980/5806600/799fde8074f5/gr5.jpg
https://cdn.ncbi.nlm.nih.gov/pmc/blobs/2980/5806600/8d96ce8452ad/gr1.jpg
https://cdn.ncbi.nlm.nih.gov/pmc/blobs/2980/5806600/41cb2c77e34b/gr2.jpg
https://cdn.ncbi.nlm.nih.gov/pmc/blobs/2980/5806600/885b615795ef/gr3.jpg
https://cdn.ncbi.nlm.nih.gov/pmc/blobs/2980/5806600/a33b4982b2bf/gr4.jpg
https://cdn.ncbi.nlm.nih.gov/pmc/blobs/2980/5806600/799fde8074f5/gr5.jpg

相似文献

1
An assessment of forest biomass maps in Europe using harmonized national statistics and inventory plots.利用统一的国家统计数据和清查样地对欧洲森林生物量地图进行评估。
For Ecol Manage. 2018 Feb 1;409:489-498. doi: 10.1016/j.foreco.2017.11.047.
2
Improving aboveground biomass maps of tropical dry forests by integrating LiDAR, ALOS PALSAR, climate and field data.通过整合激光雷达、先进陆地观测卫星相控阵L波段合成孔径雷达、气候和实地数据改进热带干燥森林地上生物量地图。
Carbon Balance Manag. 2020 Jul 29;15(1):15. doi: 10.1186/s13021-020-00151-6.
3
An integrated pan-tropical biomass map using multiple reference datasets.使用多个参考数据集的综合泛热带生物量地图。
Glob Chang Biol. 2016 Apr;22(4):1406-20. doi: 10.1111/gcb.13139. Epub 2016 Jan 10.
4
Global biomass maps can increase the precision of (sub)national aboveground biomass estimates: A comparison across tropical countries.全球生物量地图可以提高(次)国家地上生物量估计的精度:对热带国家的比较。
Sci Total Environ. 2024 Oct 15;947:174653. doi: 10.1016/j.scitotenv.2024.174653. Epub 2024 Jul 14.
5
Exploring characteristics of national forest inventories for integration with global space-based forest biomass data.探索国家森林清查与全球天基森林生物量数据集成的特点。
Sci Total Environ. 2022 Dec 1;850:157788. doi: 10.1016/j.scitotenv.2022.157788. Epub 2022 Aug 2.
6
Harmonised statistics and maps of forest biomass and increment in Europe.欧洲森林生物量和生长量的协调统计数据和地图。
Sci Data. 2024 Mar 6;11(1):274. doi: 10.1038/s41597-023-02868-8.
7
Multiscale divergence between Landsat- and lidar-based biomass mapping is related to regional variation in canopy cover and composition.基于陆地卫星和激光雷达的生物量测绘之间的多尺度差异与冠层覆盖和组成的区域变化有关。
Carbon Balance Manag. 2018 Sep 14;13(1):15. doi: 10.1186/s13021-018-0104-6.
8
Evaluating spatial coverage of data on the aboveground biomass in undisturbed forests in the Brazilian Amazon.评估巴西亚马逊地区未受干扰森林地上生物量数据的空间覆盖范围。
Carbon Balance Manag. 2019 Sep 3;14(1):11. doi: 10.1186/s13021-019-0126-8.
9
Markedly divergent estimates of Amazon forest carbon density from ground plots and satellites.基于地面样地和卫星数据对亚马逊森林碳密度的估计存在显著差异。
Glob Ecol Biogeogr. 2014 Aug;23(8):935-946. doi: 10.1111/geb.12168. Epub 2014 Apr 22.
10
Assessing forest availability for wood supply in Europe.评估欧洲用于木材供应的森林资源可得性。
For Policy Econ. 2020 Feb;111:102032. doi: 10.1016/j.forpol.2019.102032.

引用本文的文献

1
Mapping forest aboveground carbon stock of combined stratified sampling and RFRK model with mean annual temperature and precipitation.结合分层抽样和随机森林克里金(RFRK)模型,基于年均温度和降水量绘制森林地上碳储量图。
Sci Rep. 2025 May 20;15(1):17410. doi: 10.1038/s41598-025-02338-8.
2
Planted forest is catching up with natural forest in China in terms of carbon density and carbon storage.在碳密度和碳储量方面,中国人工林正在追赶天然林。
Fundam Res. 2022 Apr 22;2(5):688-696. doi: 10.1016/j.fmre.2022.04.008. eCollection 2022 Sep.
3
Harmonised statistics and maps of forest biomass and increment in Europe.

本文引用的文献

1
EU-Forest, a high-resolution tree occurrence dataset for Europe.EU-Forest,一个用于欧洲的高分辨率树木出现数据集。
Sci Data. 2017 Jan 5;4:160123. doi: 10.1038/sdata.2016.123.
2
Modelling forest carbon stock changes as affected by harvest and natural disturbances. II. EU-level analysis.模拟受采伐和自然干扰影响的森林碳储量变化。二、欧盟层面的分析。
Carbon Balance Manag. 2016 Aug 26;11(1):20. doi: 10.1186/s13021-016-0059-4. eCollection 2016 Dec.
3
An integrated pan-tropical biomass map using multiple reference datasets.使用多个参考数据集的综合泛热带生物量地图。
欧洲森林生物量和生长量的协调统计数据和地图。
Sci Data. 2024 Mar 6;11(1):274. doi: 10.1038/s41597-023-02868-8.
4
Mapping forest and site quality of planted Chinese fir forest using sentinel images.利用哨兵影像绘制人工杉木林的森林和立地质量图。
Front Plant Sci. 2022 Oct 4;13:949598. doi: 10.3389/fpls.2022.949598. eCollection 2022.
5
Improving aboveground biomass maps of tropical dry forests by integrating LiDAR, ALOS PALSAR, climate and field data.通过整合激光雷达、先进陆地观测卫星相控阵L波段合成孔径雷达、气候和实地数据改进热带干燥森林地上生物量地图。
Carbon Balance Manag. 2020 Jul 29;15(1):15. doi: 10.1186/s13021-020-00151-6.
6
A map of African humid tropical forest aboveground biomass derived from management inventories.基于管理清查数据的非洲湿润热带森林地上生物量分布图。
Sci Data. 2020 Jul 8;7(1):221. doi: 10.1038/s41597-020-0561-0.
7
Assessing forest availability for wood supply in Europe.评估欧洲用于木材供应的森林资源可得性。
For Policy Econ. 2020 Feb;111:102032. doi: 10.1016/j.forpol.2019.102032.
8
The Importance of Consistent Global Forest Aboveground Biomass Product Validation.全球森林地上生物量产品一致性验证的重要性。
Surv Geophys. 2019;40(4):979-999. doi: 10.1007/s10712-019-09538-8. Epub 2019 May 30.
Glob Chang Biol. 2016 Apr;22(4):1406-20. doi: 10.1111/gcb.13139. Epub 2016 Jan 10.
4
High-resolution global maps of 21st-century forest cover change.高分辨率的 21 世纪全球森林覆盖变化地图集。
Science. 2013 Nov 15;342(6160):850-3. doi: 10.1126/science.1244693.
5
Uncertainty in the spatial distribution of tropical forest biomass: a comparison of pan-tropical maps.热带森林生物量空间分布的不确定性:泛热带地图比较。
Carbon Balance Manag. 2013 Oct 26;8(1):10. doi: 10.1186/1750-0680-8-10.
6
Are inventory based and remotely sensed above-ground biomass estimates consistent?基于库存和遥感的地上生物量估计是否一致?
PLoS One. 2013 Sep 19;8(9):e74170. doi: 10.1371/journal.pone.0074170. eCollection 2013.
7
Potential stocks and increments of woody biomass in the European Union under different management and climate scenarios.不同管理和气候情景下欧盟木本生物质的潜在蓄积量和增量。
Carbon Balance Manag. 2013 Feb 1;8(1):2. doi: 10.1186/1750-0680-8-2.
8
Mapping biomass with remote sensing: a comparison of methods for the case study of Uganda.利用遥感技术进行生物量测绘:以乌干达为例的方法比较。
Carbon Balance Manag. 2011 Oct 7;6:7. doi: 10.1186/1750-0680-6-7.