Platzer Alexander, Polzin Julia, Rembart Klaus, Han Ping Penny, Rauer Denise, Nussbaumer Thomas
University Clinic for Internal Medicine III, Medical University of Vienna, Vienna, Austria.
Division of Microbial Ecology, Department of Microbial Ecology, University of Vienna, Vienna, Austria.
J Integr Bioinform. 2018 Jun 13;15(4):20170063. doi: 10.1515/jib-2017-0063.
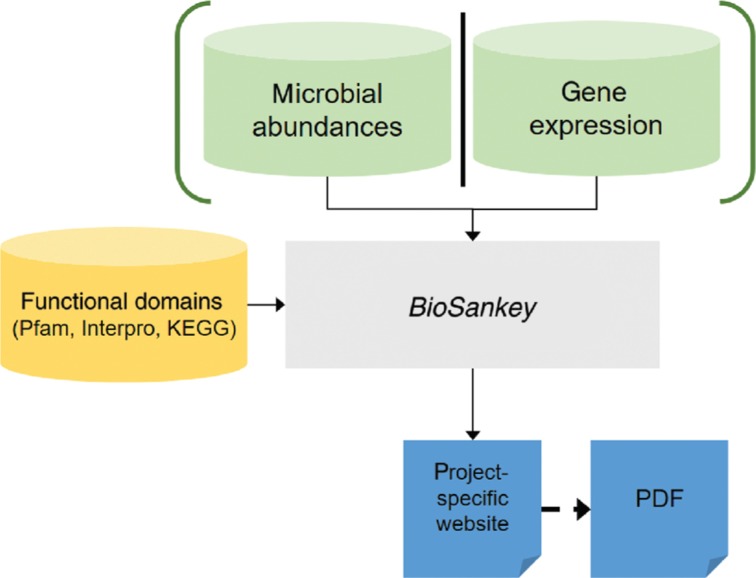
Metagenomics provides quantitative measurements for microbial species over time. To obtain a global overview of an experiment and to explore the full potential of a given dataset, intuitive and interactive visualization tools are needed. Therefore, we established BioSankey to visualize microbial species in microbiome studies over time as a Sankey diagram. These diagrams are embedded into a project-specific webpage which depends only on JavaScript and Google API to allow searches of interesting species without requiring a web server or connection to a database. BioSankey is a valuable tool to visualize different data elements from single or dual RNA-seq datasets and additionally enables a straightforward exchange of results among collaboration partners.
宏基因组学可对微生物物种随时间的变化进行定量测量。为了全面了解实验情况并挖掘给定数据集的全部潜力,需要直观且交互式的可视化工具。因此,我们开发了BioSankey,以桑基图的形式直观展示微生物组研究中微生物物种随时间的变化情况。这些图表被嵌入到特定项目的网页中,该网页仅依赖JavaScript和谷歌应用程序编程接口(Google API),无需网络服务器或连接数据库即可搜索感兴趣的物种。BioSankey是一种有价值的工具,可用于可视化来自单或双RNA测序数据集的不同数据元素,还能使合作伙伴之间直接交换结果。