Department of Mechanical Engineering, Stanford University, Stanford CA, United States of America.
Department of Bioengineering, Stanford University, Stanford CA, United States of America.
PLoS One. 2018 Jun 19;13(6):e0199238. doi: 10.1371/journal.pone.0199238. eCollection 2018.
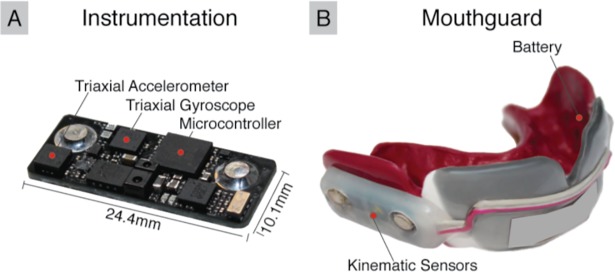
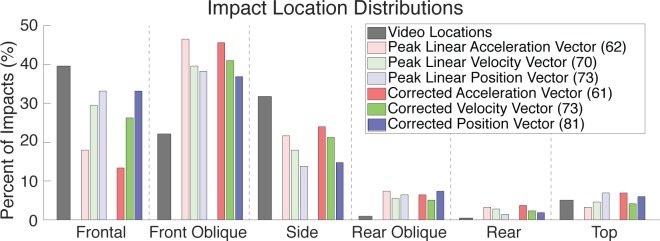
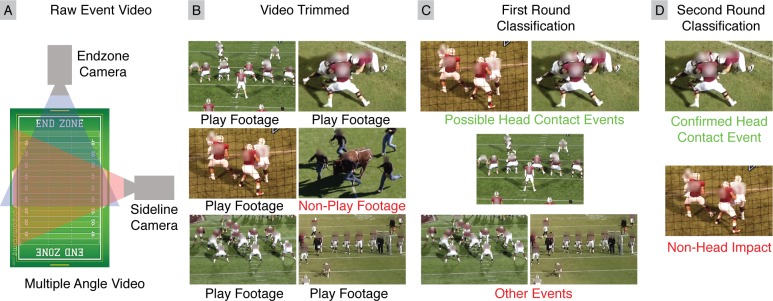
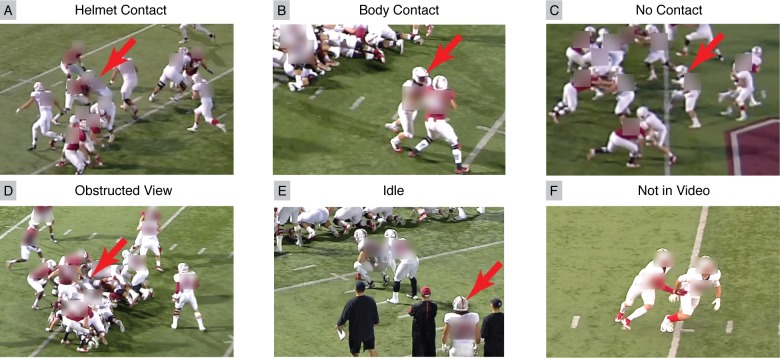
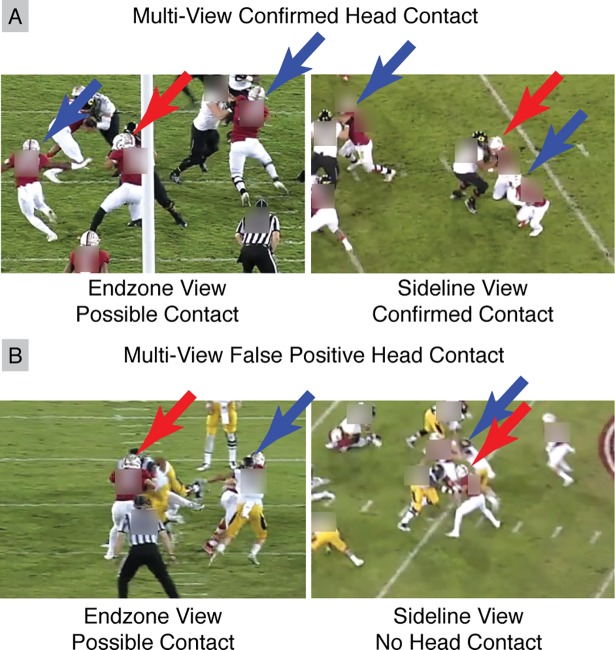
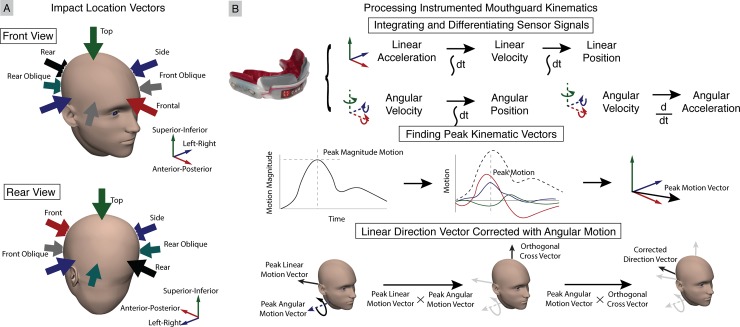
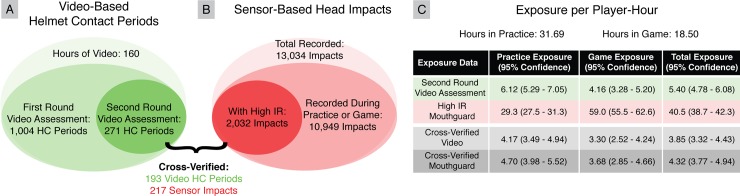
Previous research has sought to quantify head impact exposure using wearable kinematic sensors. However, many sensors suffer from poor accuracy in estimating impact kinematics and count, motivating the need for additional independent impact exposure quantification for comparison. Here, we equipped seven collegiate American football players with instrumented mouthguards, and video recorded practices and games to compare video-based and sensor-based exposure rates and impact location distributions. Over 50 player-hours, we identified 271 helmet contact periods in video, while the instrumented mouthguard sensor recorded 2,032 discrete head impacts. Matching video and mouthguard real-time stamps yielded 193 video-identified helmet contact periods and 217 sensor-recorded impacts. To compare impact locations, we binned matched impacts into frontal, rear, side, oblique, and top locations based on video observations and sensor kinematics. While both video-based and sensor-based methods found similar location distributions, our best method utilizing integrated linear and angular position only correctly predicted 81 of 217 impacts. Finally, based on the activity timeline from video assessment, we also developed a new exposure metric unique to American football quantifying number of cross-verified sensor impacts per player-play. We found significantly higher exposure during games (0.35, 95% CI: 0.29-0.42) than practices (0.20, 95% CI: 0.17-0.23) (p<0.05). In the traditional impacts per player-hour metric, we observed higher exposure during practices (4.7) than games (3.7) due to increased player activity in practices. Thus, our exposure metric accounts for variability in on-field participation. While both video-based and sensor-based exposure datasets have limitations, they can complement one another to provide more confidence in exposure statistics.
先前的研究试图使用可穿戴运动传感器来量化头部冲击暴露。然而,许多传感器在估计冲击运动学和计数方面准确性较差,因此需要额外的独立冲击暴露量化方法进行比较。在这里,我们为 7 名大学生美式橄榄球运动员配备了带有仪器的牙套,并对练习和比赛进行视频录制,以比较基于视频和基于传感器的暴露率和冲击位置分布。在超过 50 个球员小时的时间里,我们在视频中识别出 271 个头盔接触时段,而仪器化的牙套传感器记录了 2032 个离散的头部冲击。匹配视频和牙套的实时戳记产生了 193 个视频识别的头盔接触时段和 217 个传感器记录的冲击。为了比较冲击位置,我们根据视频观察和传感器运动学将匹配的冲击分为正面、背面、侧面、斜角和顶部位置。虽然基于视频和基于传感器的方法都发现了类似的位置分布,但我们利用集成线性和角位置的最佳方法仅正确预测了 217 个冲击中的 81 个。最后,根据视频评估的活动时间表,我们还开发了一种针对美式足球的新暴露度量标准,该标准量化了每个球员比赛中经交叉验证的传感器冲击次数。我们发现比赛中的暴露量(0.35,95%CI:0.29-0.42)显著高于练习(0.20,95%CI:0.17-0.23)(p<0.05)。在传统的每小时球员冲击数度量标准中,我们观察到练习中的暴露量(4.7)高于比赛(3.7),这是由于练习中球员的活动增加。因此,我们的暴露度量标准考虑了场上参与的可变性。虽然基于视频和基于传感器的暴露数据集都存在局限性,但它们可以相互补充,以提供更有信心的暴露统计数据。