Faculty of Medicine, University of Medicine and Pharmacy, Ho Chi Minh City, Vietnam.
Faculty of Medicine, Tanta University, Tanta, Egypt.
PLoS One. 2018 Jun 27;13(6):e0195955. doi: 10.1371/journal.pone.0195955. eCollection 2018.
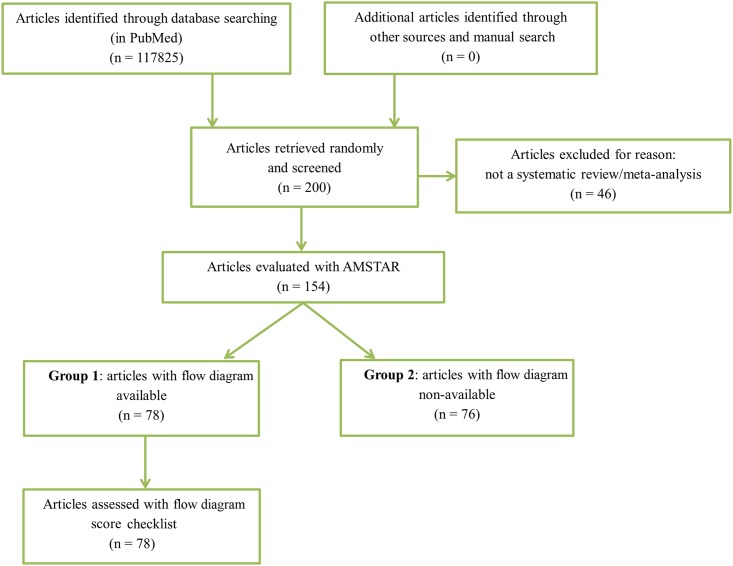
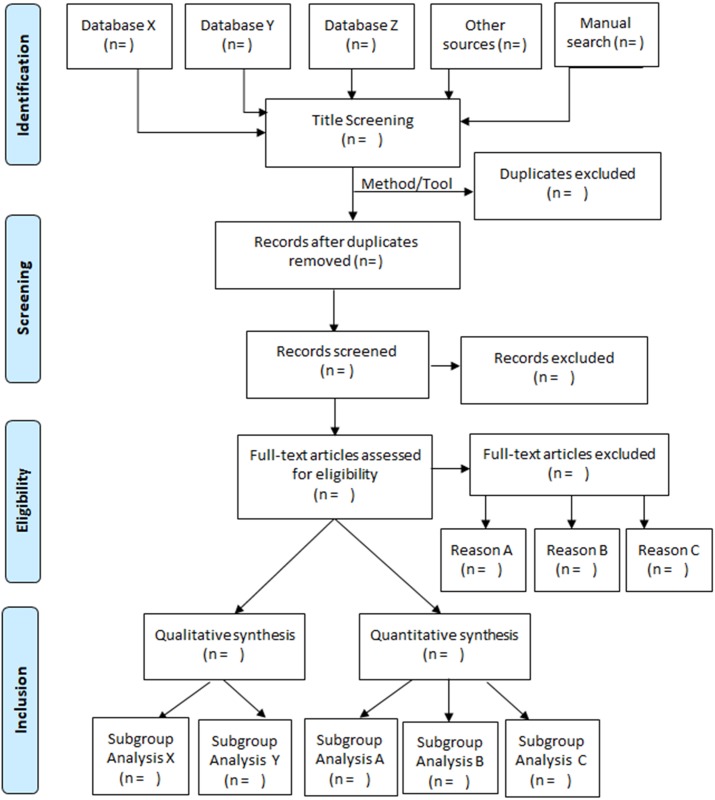
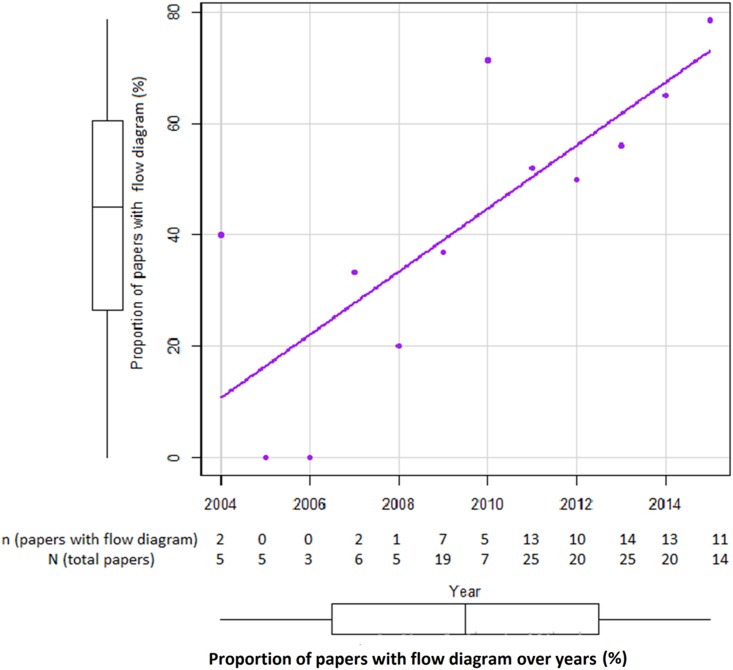
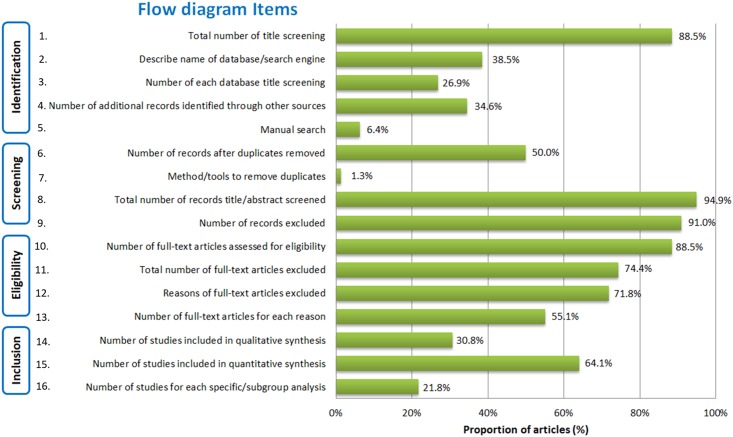
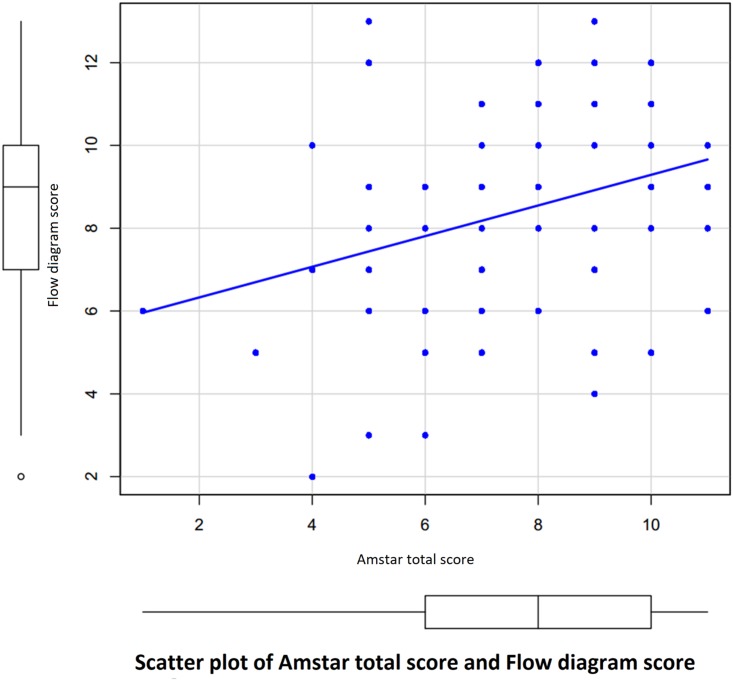
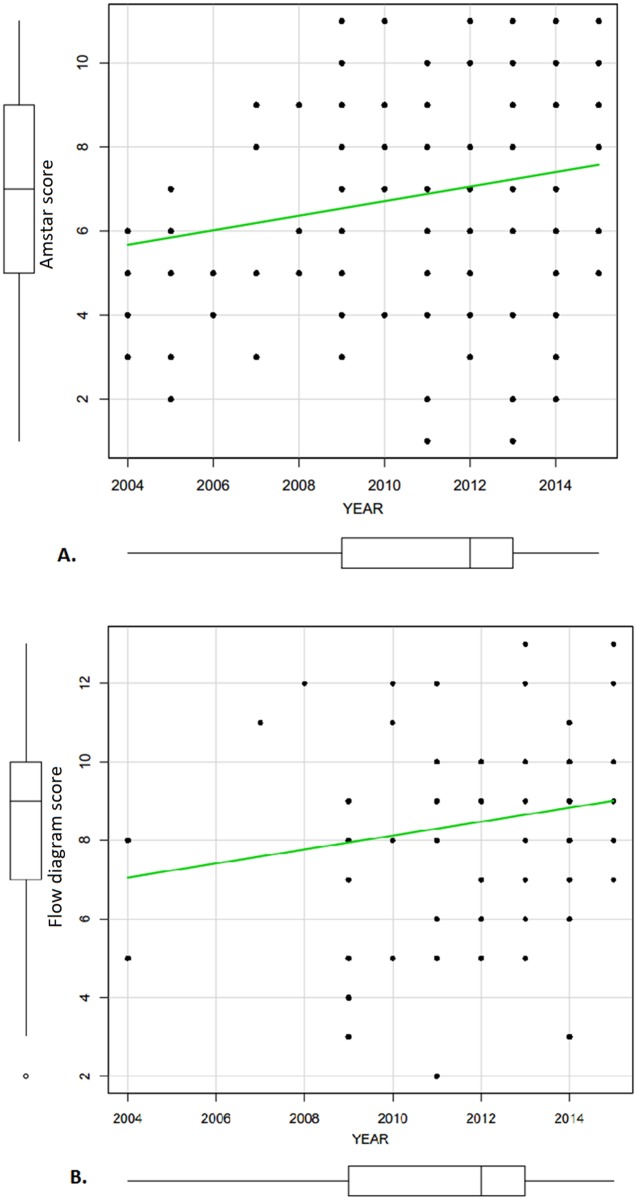
Systematic reviews and/or meta-analyses generally provide the best evidence for medical research. Authors are recommended to use flow diagrams to present the review process, allowing for better understanding among readers. However, no studies as of yet have assessed the quality of flow diagrams in systematic review/meta-analyses. Our study aims to evaluate the quality of systematic review/meta-analyses over a period of ten years, by assessing the quality of the flow diagrams, and the correlation to the methodological quality. Two hundred articles of "systematic review" and/or "meta-analysis" from January 2004 to August 2015 were randomly retrieved in Pubmed to be assessed for the flow diagram and methodological qualities. The flow diagrams were evaluated using a 16-grade scale corresponding to the four stages of PRISMA flow diagram. It composes four parts: Identification, Screening, Eligibility and Inclusion. Of the 200 articles screened, 154 articles were included and were assessed with AMSTAR checklist. Among them, 78 articles (50.6%) had the flow diagram. Over ten years, the proportion of papers with flow diagram available had been increasing significantly with regression coefficient beta = 5.649 (p = 0.002). However, the improvement in quality of the flow diagram increased slightly but not significantly (regression coefficient beta = 0.177, p = 0.133). Our analysis showed high variation in the proportion of articles that reported flow diagram components. The lowest proportions were 1% for reporting methods of duplicates removal in screening phase, followed by 6% for manual search in identification phase, 22% for number of studies for each specific/subgroup analysis, 27% for number of articles retrieved from each database, and 31% for number of studies included in qualitative analysis. The flow diagram quality was correlated with the methodological quality with the Pearson's coefficient r = 0.32 (p = 0.0039). Therefore, this review suggests that the reporting quality of flow diagram is less satisfactory, hence not maximizing the potential benefit of the flow diagrams. A guideline with standardized flow diagram is recommended to improve the quality of systematic reviews, and to enable better reader comprehension of the review process.
系统评价和/或荟萃分析通常为医学研究提供最佳证据。作者被建议使用流程图来展示审查过程,以便读者更好地理解。然而,目前尚无研究评估系统评价/荟萃分析中流程图的质量。我们的研究旨在通过评估流程图的质量及其与方法学质量的相关性,来评估十年来系统评价/荟萃分析的质量。从 2004 年 1 月至 2015 年 8 月,我们在 PubMed 中随机检索了 200 篇“系统评价”和/或“荟萃分析”的文章,以评估流程图和方法学质量。使用与 PRISMA 流程图的四个阶段相对应的 16 级量表评估流程图。它由四部分组成:识别、筛选、合格和纳入。在筛选出的 200 篇文章中,有 154 篇被纳入并使用 AMSTAR 清单进行评估。其中,有 78 篇(50.6%)有流程图。十年来,随着回归系数β=5.649(p=0.002)的增加,有流程图的论文比例显著增加。然而,流程图质量的提高幅度较小,且不显著(回归系数β=0.177,p=0.133)。我们的分析显示,报告流程图组成部分的文章比例差异很大。报告筛选阶段重复去除方法的比例最低,为 1%;识别阶段的手工搜索比例为 6%;每个特定/亚组分析的研究数量比例为 22%;每个数据库检索到的文章数量比例为 27%;定性分析中纳入的研究数量比例为 31%。流程图质量与方法学质量呈正相关,皮尔逊相关系数 r=0.32(p=0.0039)。因此,本综述表明,流程图的报告质量不尽如人意,未能最大限度地发挥流程图的潜在效益。建议使用标准化流程图指南来提高系统评价的质量,并使读者更好地理解审查过程。