• 文献检索
  • 文档翻译
  • 深度研究
  • 学术资讯
  • Suppr Zotero 插件Zotero 插件
  • 邀请有礼
  • 套餐&价格
  • 历史记录
应用&插件
Suppr Zotero 插件Zotero 插件浏览器插件Mac 客户端Windows 客户端微信小程序
定价
高级版会员购买积分包购买API积分包
服务
文献检索文档翻译深度研究API 文档MCP 服务
关于我们
关于 Suppr公司介绍联系我们用户协议隐私条款
关注我们

Suppr 超能文献

核心技术专利:CN118964589B侵权必究
粤ICP备2023148730 号-1Suppr @ 2026

文献检索

告别复杂PubMed语法,用中文像聊天一样搜索,搜遍4000万医学文献。AI智能推荐,让科研检索更轻松。

立即免费搜索

文件翻译

保留排版,准确专业,支持PDF/Word/PPT等文件格式,支持 12+语言互译。

免费翻译文档

深度研究

AI帮你快速写综述,25分钟生成高质量综述,智能提取关键信息,辅助科研写作。

立即免费体验

GrapHi-C:基于图形的Hi-C数据集可视化

GrapHi-C: graph-based visualization of Hi-C datasets.

作者信息

MacKay Kimberly, Kusalik Anthony, Eskiw Christopher H

机构信息

Department of Computer Science, University of Saskatchewan, 110 Science Place, Saskatoon, SK, S7N 5C9, Canada.

Department of Food and Bioproduct Science, University of Saskatchewan, 51 Campus Drive, Saskatoon, SK, S7N 5A8, Canada.

出版信息

BMC Res Notes. 2018 Jun 29;11(1):418. doi: 10.1186/s13104-018-3507-2.

DOI:10.1186/s13104-018-3507-2
PMID:29958536
原文链接:https://pmc.ncbi.nlm.nih.gov/articles/PMC6025839/
Abstract

OBJECTIVES

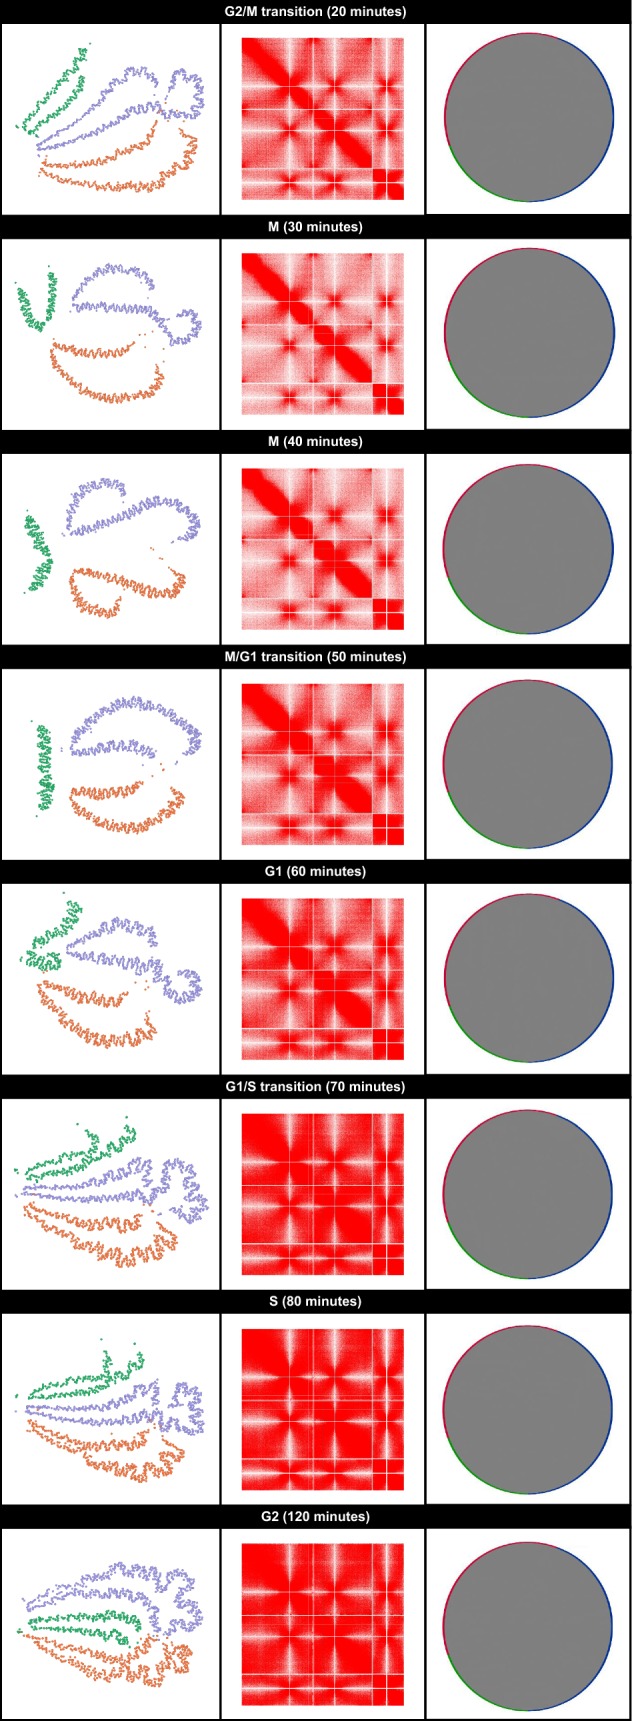
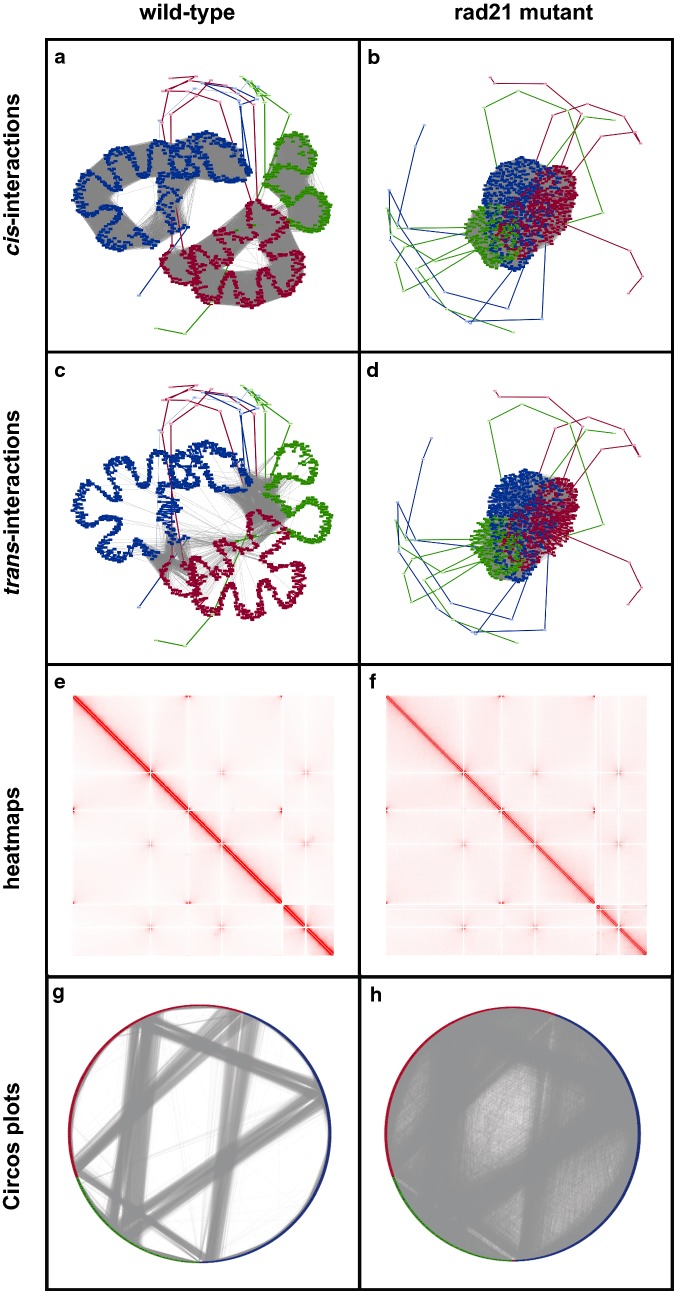
Hi-C is a proximity-based ligation reaction used to detect regions of the genome that are close in 3D space (or "interacting"). Typically, results from Hi-C experiments (contact maps) are visualized as heatmaps or Circos plots. While informative, these visualizations do not directly represent genomic structure and folding, making the interpretation of the underlying 3D genomic organization obscured. Our objective was to generate a graph-based contact map representation that leads to a more intuitive structural visualization.

RESULTS

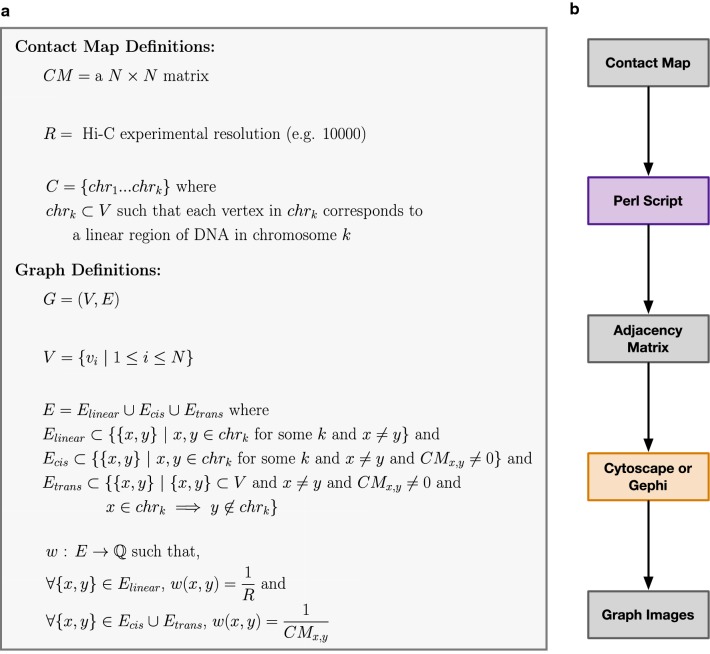
Normalized contact maps were converted into undirected graphs where each vertex represented a genomic region and each edge represented a detected (intra- and inter-chromosomal) or known (linear) interaction between two regions. Each edge was weighted by the inverse of the linear distance (Hi-C experimental resolution) or the interaction frequency from the contact map. Graphs were generated based on this representation scheme for contact maps from existing fission yeast datasets. Originally, these datasets were used to (1) identify specific principles influencing fission yeast genome organization and (2) uncover changes in fission yeast genome organization during the cell cycle. When compared to the equivalent heatmaps and/or Circos plots, the graph-based visualizations more intuitively depicted the changes in genome organization described in the original studies.

摘要

目的

Hi-C是一种基于邻近连接反应的技术,用于检测基因组中在三维空间中距离相近(或“相互作用”)的区域。通常,Hi-C实验的结果(接触图谱)以热图或Circos图的形式呈现。虽然这些可视化方式提供了信息,但它们并不能直接代表基因组结构和折叠情况,使得对潜在三维基因组组织的解读变得模糊。我们的目标是生成一种基于图形的接触图谱表示形式,从而实现更直观的结构可视化。

结果

将标准化的接触图谱转换为无向图,其中每个顶点代表一个基因组区域,每条边代表两个区域之间检测到的(染色体内和染色体间)或已知的(线性)相互作用。每条边的权重为线性距离的倒数(Hi-C实验分辨率)或来自接触图谱的相互作用频率。基于这种表示方案,为来自现有裂殖酵母数据集的接触图谱生成了图形。最初,这些数据集用于(1)确定影响裂殖酵母基因组组织的特定原则,以及(2)揭示细胞周期中裂殖酵母基因组组织的变化。与等效的热图和/或Circos图相比,基于图形的可视化更直观地描绘了原始研究中描述的基因组组织变化。

https://cdn.ncbi.nlm.nih.gov/pmc/blobs/9dd1/6025839/e2dd68e1f782/13104_2018_3507_Fig3_HTML.jpg
https://cdn.ncbi.nlm.nih.gov/pmc/blobs/9dd1/6025839/ce4d7fe650a1/13104_2018_3507_Fig1_HTML.jpg
https://cdn.ncbi.nlm.nih.gov/pmc/blobs/9dd1/6025839/a670c2249911/13104_2018_3507_Fig2_HTML.jpg
https://cdn.ncbi.nlm.nih.gov/pmc/blobs/9dd1/6025839/e2dd68e1f782/13104_2018_3507_Fig3_HTML.jpg
https://cdn.ncbi.nlm.nih.gov/pmc/blobs/9dd1/6025839/ce4d7fe650a1/13104_2018_3507_Fig1_HTML.jpg
https://cdn.ncbi.nlm.nih.gov/pmc/blobs/9dd1/6025839/a670c2249911/13104_2018_3507_Fig2_HTML.jpg
https://cdn.ncbi.nlm.nih.gov/pmc/blobs/9dd1/6025839/e2dd68e1f782/13104_2018_3507_Fig3_HTML.jpg

相似文献

1
GrapHi-C: graph-based visualization of Hi-C datasets.GrapHi-C:基于图形的Hi-C数据集可视化
BMC Res Notes. 2018 Jun 29;11(1):418. doi: 10.1186/s13104-018-3507-2.
2
The corrected gene proximity map for analyzing the 3D genome organization using Hi-C data.使用 Hi-C 数据分析 3D 基因组结构的基因邻近校正图谱。
BMC Bioinformatics. 2020 May 29;21(1):222. doi: 10.1186/s12859-020-03545-y.
3
A maximum likelihood algorithm for reconstructing 3D structures of human chromosomes from chromosomal contact data.从染色体接触数据中重建人类染色体 3D 结构的最大似然算法。
BMC Genomics. 2018 Feb 23;19(1):161. doi: 10.1186/s12864-018-4546-8.
4
Hi-C: a method to study the three-dimensional architecture of genomes.Hi-C:一种研究基因组三维结构的方法。
J Vis Exp. 2010 May 6(39):1869. doi: 10.3791/1869.
5
Normalization of Chromosome Contact Maps: Matrix Balancing and Visualization.染色体接触图谱的标准化:矩阵平衡和可视化。
Methods Mol Biol. 2022;2301:1-15. doi: 10.1007/978-1-0716-1390-0_1.
6
Practical Analysis of Genome Contact Interaction Experiments.基因组接触相互作用实验的实践分析
Methods Mol Biol. 2016;1418:177-89. doi: 10.1007/978-1-4939-3578-9_9.
7
ClusterTAD: an unsupervised machine learning approach to detecting topologically associated domains of chromosomes from Hi-C data.ClusterTAD:一种从Hi-C数据中检测染色体拓扑相关结构域的无监督机器学习方法。
BMC Bioinformatics. 2017 Nov 14;18(1):480. doi: 10.1186/s12859-017-1931-2.
8
Assessing relationships between chromatin interactions and regulatory genomic activities using the self-organizing map.利用自组织映射评估染色质相互作用与调控基因组活性之间的关系。
Methods. 2021 May;189:12-21. doi: 10.1016/j.ymeth.2020.07.002. Epub 2020 Jul 9.
9
Advantages of using graph databases to explore chromatin conformation capture experiments.使用图数据库探索染色质构象捕获实验的优势。
BMC Bioinformatics. 2021 Apr 26;22(Suppl 2):43. doi: 10.1186/s12859-020-03937-0.
10
Genome U-Plot: a whole genome visualization.基因组 U 形图:全基因组可视化。
Bioinformatics. 2018 May 15;34(10):1629-1634. doi: 10.1093/bioinformatics/btx829.

引用本文的文献

1
Loop Catalog: a comprehensive HiChIP database of human and mouse samples.环状图谱:一个包含人类和小鼠样本的全面的HiChIP数据库。
bioRxiv. 2025 Mar 6:2024.04.26.591349. doi: 10.1101/2024.04.26.591349.
2
Computational methods for predicting 3D genomic organization from high-resolution chromosome conformation capture data.从高分辨率染色体构象捕获数据中预测 3D 基因组结构的计算方法。
Brief Funct Genomics. 2020 Jul 29;19(4):292-308. doi: 10.1093/bfgp/elaa004.
3
Using GARDEN-NET and ChAseR to explore human haematopoietic 3D chromatin interaction networks.

本文引用的文献

1
Architectural alterations of the fission yeast genome during the cell cycle.裂殖酵母基因组在细胞周期中的结构改变。
Nat Struct Mol Biol. 2017 Nov;24(11):965-976. doi: 10.1038/nsmb.3482. Epub 2017 Oct 9.
2
Software tools for visualizing Hi-C data.用于可视化Hi-C数据的软件工具。
Genome Biol. 2017 Feb 3;18(1):26. doi: 10.1186/s13059-017-1161-y.
3
3D genome organization in health and disease: emerging opportunities in cancer translational medicine.健康与疾病中的三维基因组组织:癌症转化医学的新机遇
使用 GARDEN-NET 和 ChAseR 探索人类造血 3D 染色质相互作用网络。
Nucleic Acids Res. 2020 May 7;48(8):4066-4080. doi: 10.1093/nar/gkaa159.
Nucleus. 2015;6(5):382-93. doi: 10.1080/19491034.2015.1106676.
4
Analysis methods for studying the 3D architecture of the genome.用于研究基因组三维结构的分析方法。
Genome Biol. 2015 Sep 2;16:183. doi: 10.1186/s13059-015-0745-7.
5
Chromosome domain architecture and dynamic organization of the fission yeast genome.裂殖酵母基因组的染色体结构域架构与动态组织
FEBS Lett. 2015 Oct 7;589(20 Pt A):2975-86. doi: 10.1016/j.febslet.2015.06.008. Epub 2015 Jun 19.
6
Hi-Corrector: a fast, scalable and memory-efficient package for normalizing large-scale Hi-C data.Hi-Corrector:一个用于大规模Hi-C数据归一化的快速、可扩展且内存高效的软件包。
Bioinformatics. 2015 Mar 15;31(6):960-2. doi: 10.1093/bioinformatics/btu747. Epub 2014 Nov 12.
7
Cohesin-dependent globules and heterochromatin shape 3D genome architecture in S. pombe.黏合蛋白依赖性液滴和异染色质塑造 S. pombe 的三维基因组结构。
Nature. 2014 Dec 18;516(7531):432-435. doi: 10.1038/nature13833. Epub 2014 Oct 12.
8
ForceAtlas2, a continuous graph layout algorithm for handy network visualization designed for the Gephi software.ForceAtlas2,一种为Gephi软件设计的用于便捷网络可视化的连续图布局算法。
PLoS One. 2014 Jun 10;9(6):e98679. doi: 10.1371/journal.pone.0098679. eCollection 2014.
9
CytoHiC: a cytoscape plugin for visual comparison of Hi-C networks.CytoHiC:用于可视化比较 Hi-C 网络的 cytoscape 插件。
Bioinformatics. 2013 May 1;29(9):1206-7. doi: 10.1093/bioinformatics/btt120. Epub 2013 Mar 18.
10
Iterative correction of Hi-C data reveals hallmarks of chromosome organization.迭代修正 Hi-C 数据揭示了染色体组织的特征。
Nat Methods. 2012 Oct;9(10):999-1003. doi: 10.1038/nmeth.2148. Epub 2012 Sep 2.