Rigdon Joseph, Baiocchi Michael, Basu Sanjay
Quantitative Sciences Unit, Stanford University School of Medicine, 1070 Arastradero Road #3C3104, MC 5559, Palo Alto, California, 94304, USA.
Stanford Prevention Research Center, Stanford University School of Medicine, Medical School Office Building, Room 318,1265 Welch Road, MC 5411, Stanford, CA, 94305, USA.
Trials. 2018 Jul 16;19(1):382. doi: 10.1186/s13063-018-2774-5.
Heterogeneous treatment effects (HTEs), or systematic differences in treatment effectiveness among participants with different observable features, may be important when applying trial results to clinical practice. Current methods suffer from a potential for false detection of HTEs due to imbalances in covariates between candidate subgroups.
We introduce a new method, matching plus classification and regression trees (mCART), that yields balance in covariates in identified HTE subgroups. We compared mCART to a classical method (logistic regression [LR] with backwards covariate selection using the Akaike information criterion ) and two machine-learning approaches increasingly applied to HTE detection (random forest [RF] and gradient RF) in simulations with a binary outcome with known HTE subgroups. We considered an N = 200 phase II oncology trial where there were either no HTEs (1A) or two HTE subgroups (1B) and an N = 6000 phase III cardiovascular disease trial where there were either no HTEs (2A) or four HTE subgroups (2B). Additionally, we considered an N = 6000 phase III cardiovascular disease trial where there was no average treatment effect but there were four HTE subgroups (2C).
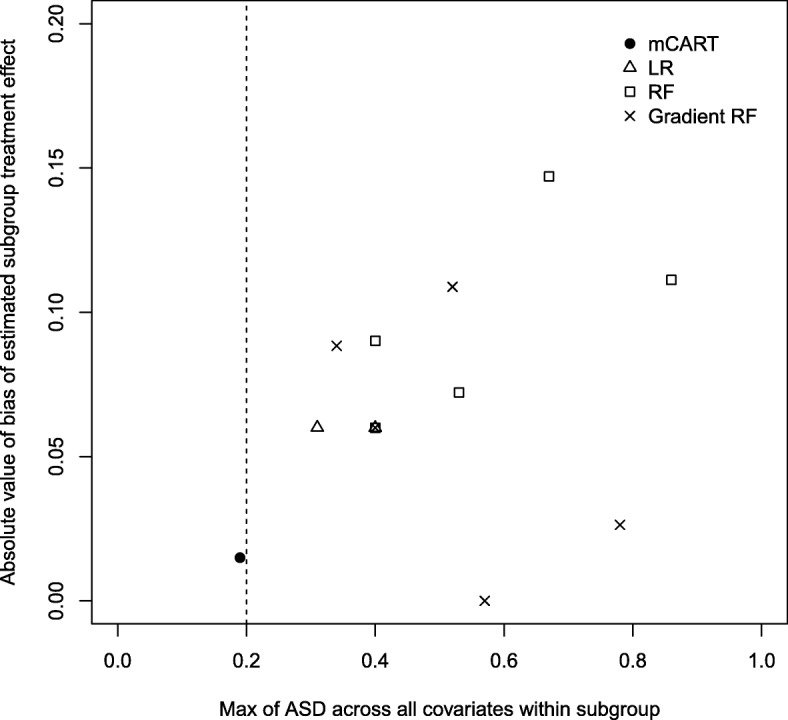
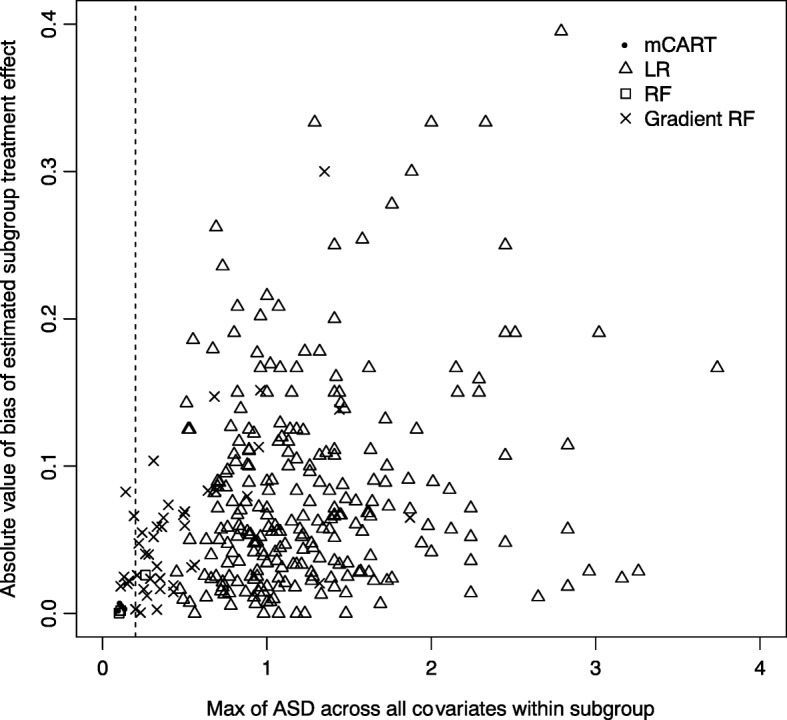
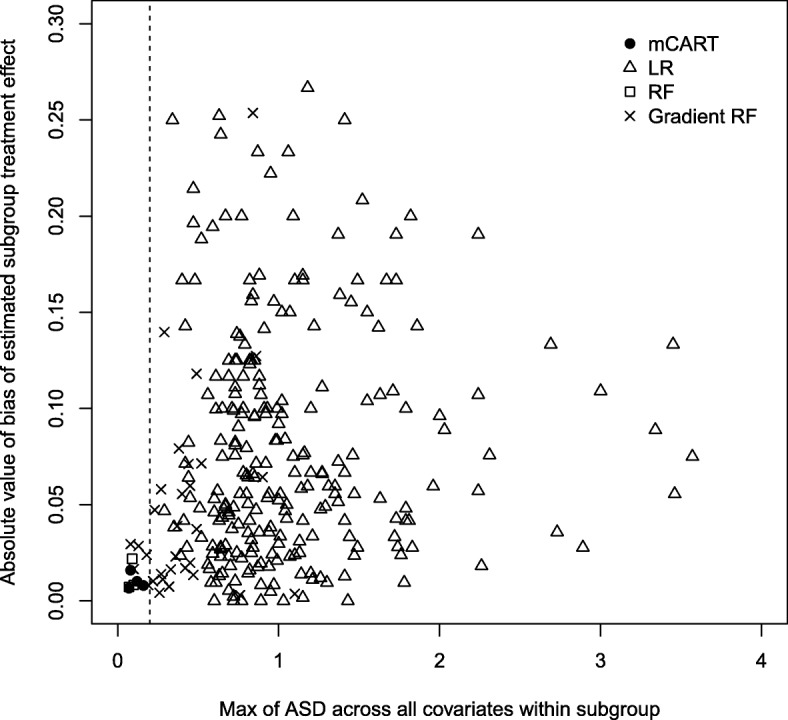
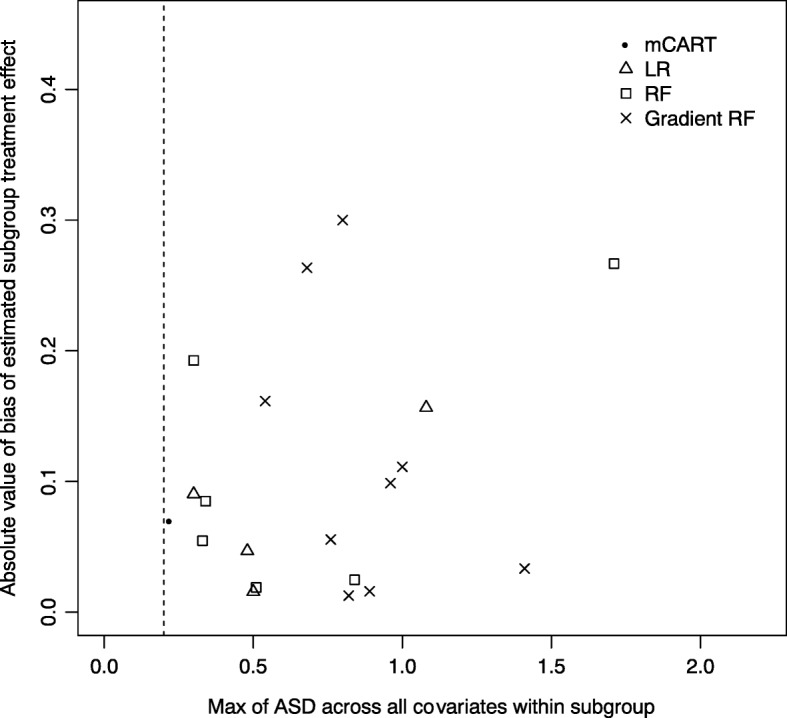
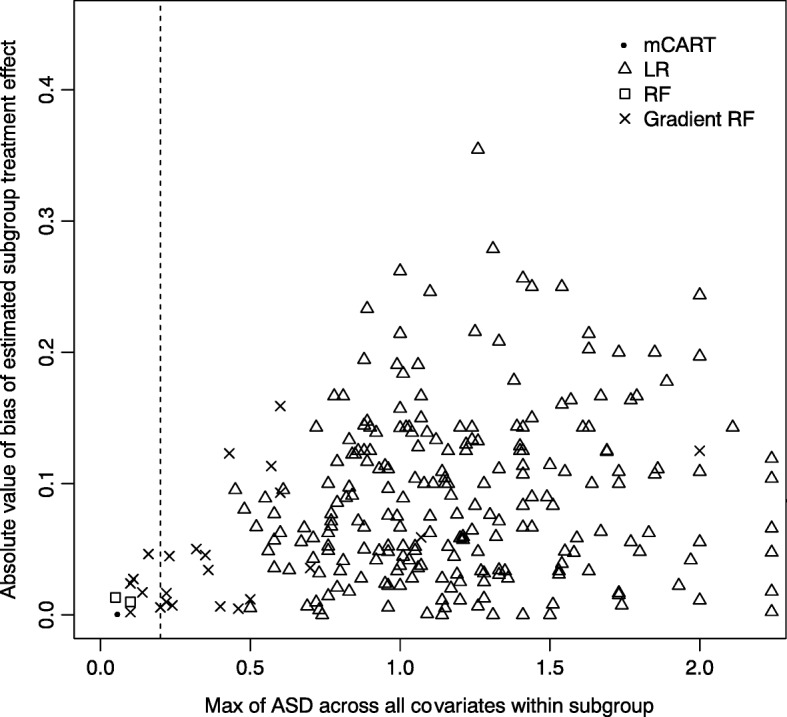
In simulations 1A and 2A (no HTEs), mCART did not identify any HTE subgroups, whereas LR found 2 and 448, RF 5 and 2, and gradient RF 5 and 24, respectively (all false positives). In simulation 1B, mCART failed to identify the two true HTE subgroups whereas LR found 4, RF 6, and gradient RF 10 (half or more of which were false positives). In simulations 2B and 2C, mCART captured the four true HTE subgroups, whereas the other methods found only false positives. All HTE subgroups identified by mCART had acceptable treated vs. control covariate balance with absolute standardized differences less than 0.2, whereas the absolute standardized differences for the other methods typically exceeded 0.2. The imbalance in covariates in identified subgroups for LR, RF, and gradient RF indicates the false HTE detection may have been due to confounding.
Covariate imbalances may be producing false positives in subgroup analyses. mCART could be a useful tool to help prevent the false discovery of HTE subgroups in secondary analyses of randomized trial data.
异质性治疗效果(HTEs),即具有不同可观察特征的参与者在治疗效果上的系统性差异,在将试验结果应用于临床实践时可能很重要。由于候选亚组之间协变量的不平衡,当前方法存在误判HTEs的可能性。
我们引入了一种新方法,匹配加分类与回归树(mCART),该方法能使已识别的HTE亚组中的协变量达到平衡。在具有已知HTE亚组的二元结局模拟中,我们将mCART与一种经典方法(使用赤池信息准则进行反向协变量选择的逻辑回归[LR])以及两种越来越多地应用于HTE检测的机器学习方法(随机森林[RF]和梯度随机森林)进行了比较。我们考虑了一项N = 200的II期肿瘤学试验,其中要么不存在HTEs(1A),要么存在两个HTE亚组(1B),以及一项N = 6000的III期心血管疾病试验,其中要么不存在HTEs(2A),要么存在四个HTE亚组(2B)。此外,我们还考虑了一项N = 6000的III期心血管疾病试验,其中不存在平均治疗效果,但存在四个HTE亚组(2C)。
在模拟1A和2A(不存在HTEs)中,mCART未识别出任何HTE亚组,而LR分别发现了2个和448个,RF发现了5个和2个,梯度随机森林发现了5个和24个(均为假阳性)。在模拟1B中,mCART未能识别出两个真正的HTE亚组,而LR发现了4个,RF发现了6个,梯度随机森林发现了10个(其中一半或更多为假阳性)。在模拟2B和2C中,mCART捕捉到了四个真正的HTE亚组,而其他方法只发现了假阳性。mCART识别出的所有HTE亚组在治疗组与对照组协变量平衡方面均可接受,绝对标准化差异小于0.2,而其他方法的绝对标准化差异通常超过0.2。LR、RF和梯度随机森林在已识别亚组中的协变量不平衡表明,误判HTEs可能是由于混杂因素导致的。
协变量不平衡可能在亚组分析中产生假阳性结果。mCART可能是一种有用的工具,有助于在随机试验数据的二次分析中防止误发现HTE亚组。