Brennan Paul
Centre for Medical Education, School of Medicine, Cardiff University, Cardiff, Wales, UK.
F1000Res. 2018 Jul 18;7:1105. doi: 10.12688/f1000research.14541.1. eCollection 2018.
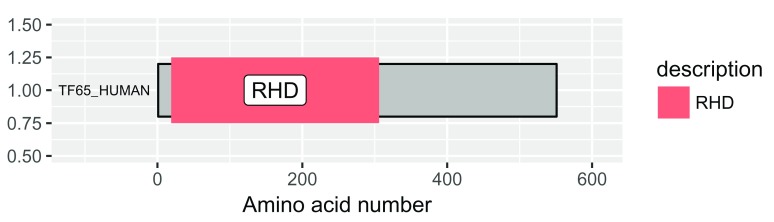
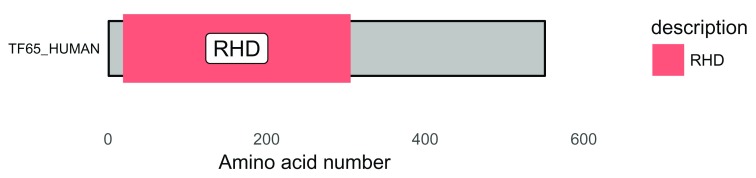
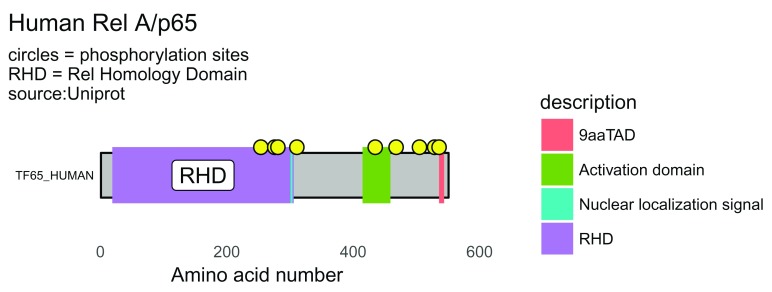
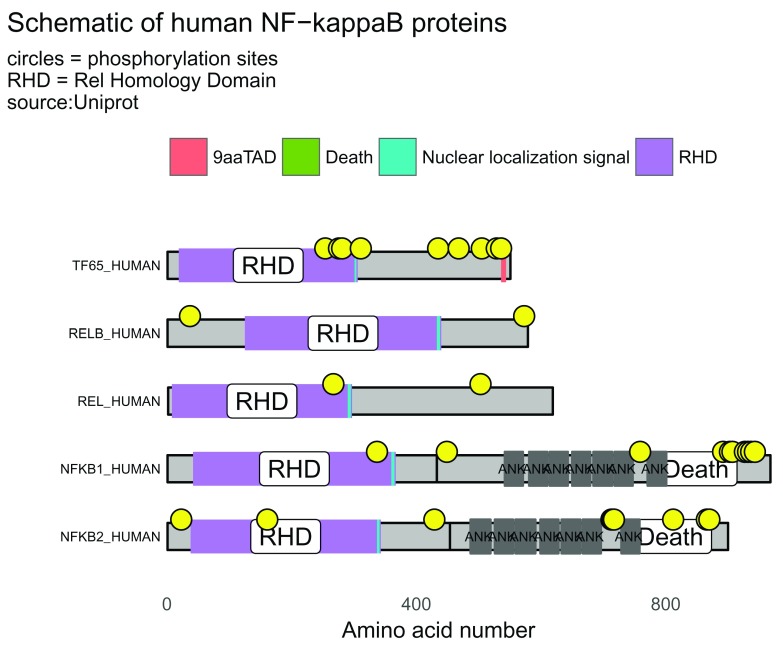
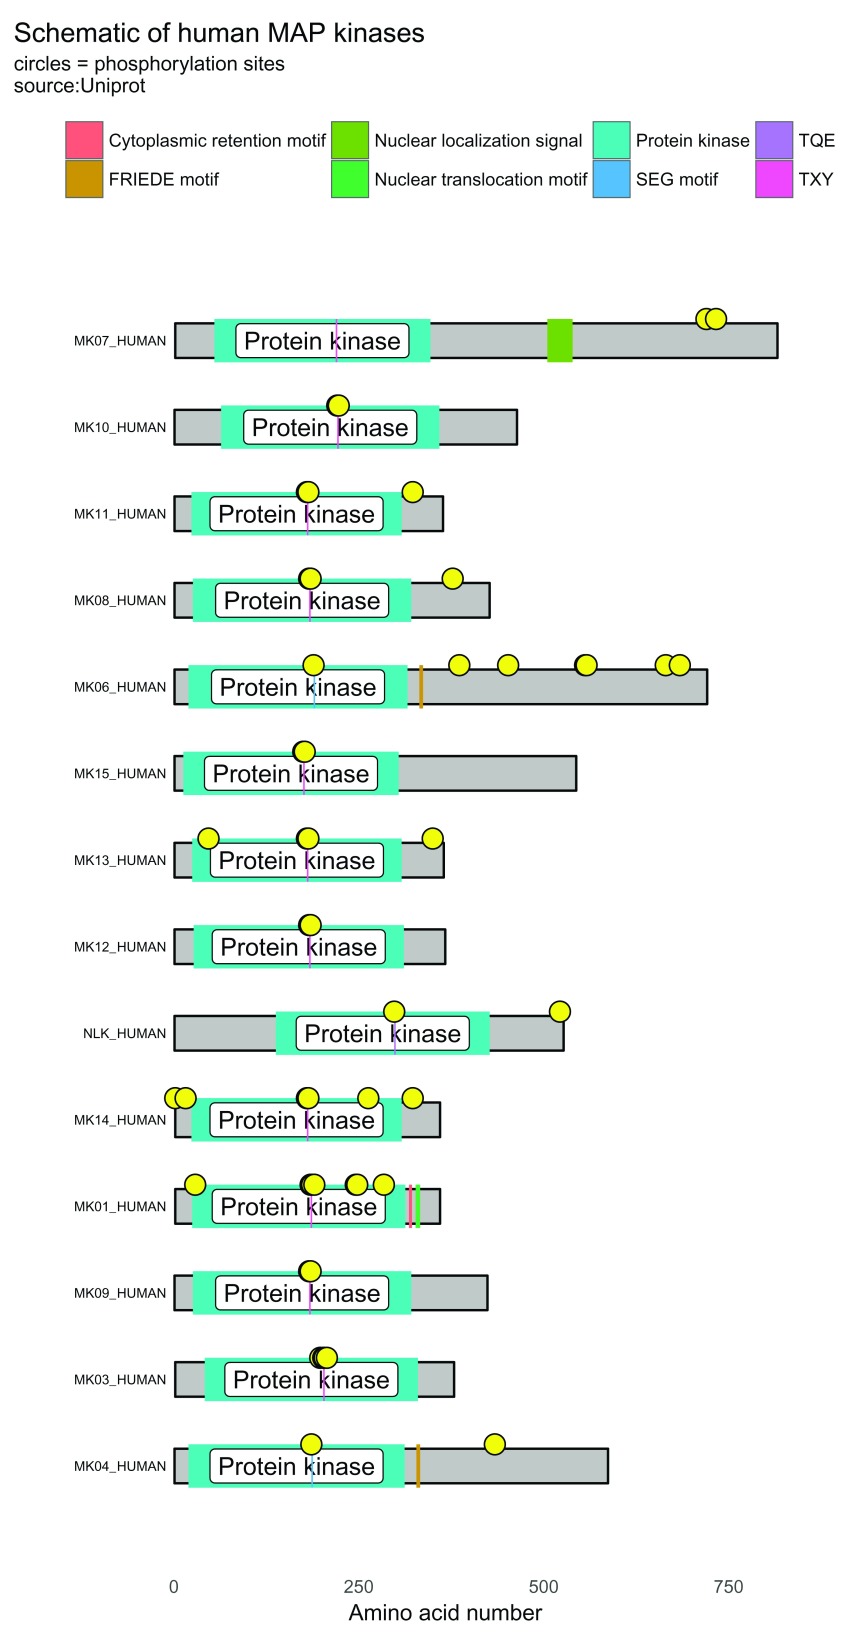
Protein schematics are valuable for research, teaching and knowledge communication. However, the tools used to automate the process are challenging. The purpose of the drawProteins package is to enable the generation of schematics of proteins in an automated fashion that can integrate with the Bioconductor/R suite of tools for bioinformatics and statistical analysis. Using UniProt accession numbers, the package uses the UniProt API to get the features of the protein from the UniProt database. The features are assembled into a data frame and visualized using adaptations of the ggplot2 package. Visualizations can be customised in many ways including adding additional protein features information from other data frames, altering colors and protein names and adding extra layers using other ggplot2 functions. This can be completed within a script that makes the workflow reproducible and sharable.
蛋白质示意图对于研究、教学和知识交流具有重要价值。然而,用于自动化这一过程的工具颇具挑战性。drawProteins软件包的目的是能够以自动化方式生成蛋白质示意图,使其可以与用于生物信息学和统计分析的Bioconductor/R工具套件集成。该软件包使用UniProt登录号,通过UniProt API从UniProt数据库获取蛋白质的特征。这些特征被组装成一个数据框,并使用ggplot2软件包的改编版本进行可视化。可视化可以通过多种方式进行定制,包括从其他数据框添加额外的蛋白质特征信息、改变颜色和蛋白质名称以及使用其他ggplot2函数添加额外的图层。这可以在一个脚本中完成,使工作流程具有可重复性和可共享性。