• 文献检索
  • 文档翻译
  • 深度研究
  • 学术资讯
  • Suppr Zotero 插件Zotero 插件
  • 邀请有礼
  • 套餐&价格
  • 历史记录
应用&插件
Suppr Zotero 插件Zotero 插件浏览器插件Mac 客户端Windows 客户端微信小程序
定价
高级版会员购买积分包购买API积分包
服务
文献检索文档翻译深度研究API 文档MCP 服务
关于我们
关于 Suppr公司介绍联系我们用户协议隐私条款
关注我们

Suppr 超能文献

核心技术专利:CN118964589B侵权必究
粤ICP备2023148730 号-1Suppr @ 2026

文献检索

告别复杂PubMed语法,用中文像聊天一样搜索,搜遍4000万医学文献。AI智能推荐,让科研检索更轻松。

立即免费搜索

文件翻译

保留排版,准确专业,支持PDF/Word/PPT等文件格式,支持 12+语言互译。

免费翻译文档

深度研究

AI帮你快速写综述,25分钟生成高质量综述,智能提取关键信息,辅助科研写作。

立即免费体验

基于 TF-IDF 的单细胞 RNA-seq 数据聚类方法。

Single cell RNA-seq data clustering using TF-IDF based methods.

机构信息

University of Connecticut, Storrs, 06269, CT, USA.

出版信息

BMC Genomics. 2018 Aug 13;19(Suppl 6):569. doi: 10.1186/s12864-018-4922-4.

DOI:10.1186/s12864-018-4922-4
PMID:30367575
原文链接:https://pmc.ncbi.nlm.nih.gov/articles/PMC6101073/
Abstract

BACKGROUND

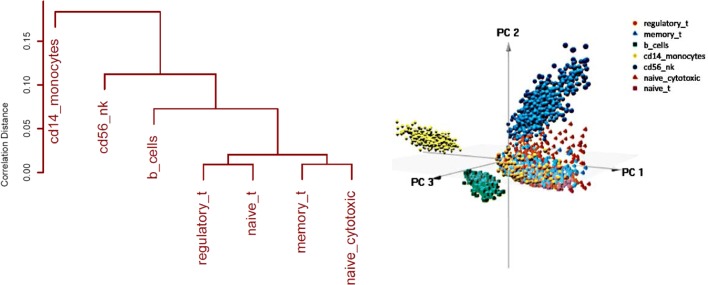
Single cell transcriptomics is critical for understanding cellular heterogeneity and identification of novel cell types. Leveraging the recent advances in single cell RNA sequencing (scRNA-Seq) technology requires novel unsupervised clustering algorithms that are robust to high levels of technical and biological noise and scale to datasets of millions of cells.

RESULTS

We present novel computational approaches for clustering scRNA-seq data based on the Term Frequency - Inverse Document Frequency (TF-IDF) transformation that has been successfully used in the field of text analysis.

CONCLUSIONS

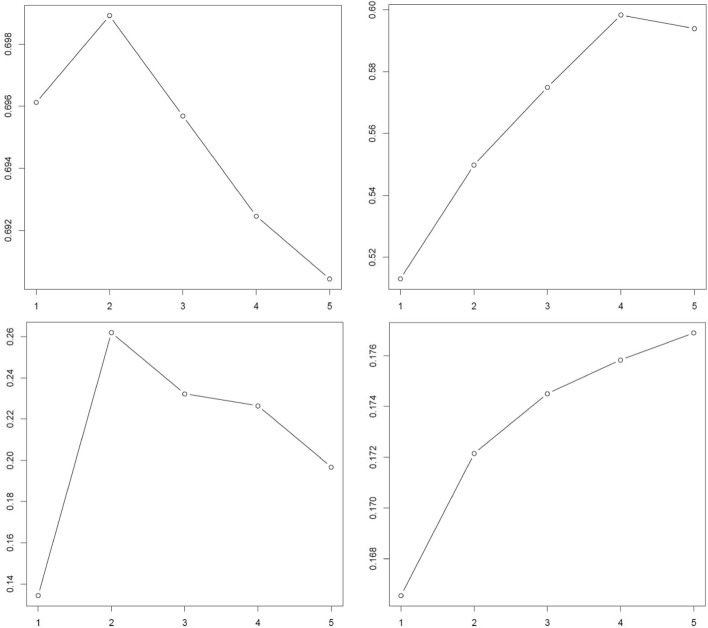
Empirical experimental results show that TF-IDF methods consistently outperform commonly used scRNA-Seq clustering approaches.

摘要

背景

单细胞转录组学对于理解细胞异质性和新型细胞类型的鉴定至关重要。利用单细胞 RNA 测序(scRNA-Seq)技术的最新进展需要新的无监督聚类算法,这些算法需要具有较强的抗高水平技术和生物噪声的能力,并能够扩展到数百万个细胞的数据集。

结果

我们提出了基于词频-逆文档频率(TF-IDF)转换的 scRNA-seq 数据聚类的新计算方法,该方法已成功应用于文本分析领域。

结论

实验结果表明,TF-IDF 方法始终优于常用的 scRNA-Seq 聚类方法。

https://cdn.ncbi.nlm.nih.gov/pmc/blobs/a0c9/6101073/64040b526e3e/12864_2018_4922_Fig12_HTML.jpg
https://cdn.ncbi.nlm.nih.gov/pmc/blobs/a0c9/6101073/ed1938844fc4/12864_2018_4922_Fig1_HTML.jpg
https://cdn.ncbi.nlm.nih.gov/pmc/blobs/a0c9/6101073/e9247d4114bd/12864_2018_4922_Fig2_HTML.jpg
https://cdn.ncbi.nlm.nih.gov/pmc/blobs/a0c9/6101073/91b0009e671d/12864_2018_4922_Fig3_HTML.jpg
https://cdn.ncbi.nlm.nih.gov/pmc/blobs/a0c9/6101073/e9e1ea02d53a/12864_2018_4922_Fig4_HTML.jpg
https://cdn.ncbi.nlm.nih.gov/pmc/blobs/a0c9/6101073/498c3ea36f0b/12864_2018_4922_Fig5_HTML.jpg
https://cdn.ncbi.nlm.nih.gov/pmc/blobs/a0c9/6101073/f15bec88890c/12864_2018_4922_Fig6_HTML.jpg
https://cdn.ncbi.nlm.nih.gov/pmc/blobs/a0c9/6101073/466e0f94ab98/12864_2018_4922_Fig7_HTML.jpg
https://cdn.ncbi.nlm.nih.gov/pmc/blobs/a0c9/6101073/d98ae2224c15/12864_2018_4922_Fig8_HTML.jpg
https://cdn.ncbi.nlm.nih.gov/pmc/blobs/a0c9/6101073/80489fd35231/12864_2018_4922_Fig9_HTML.jpg
https://cdn.ncbi.nlm.nih.gov/pmc/blobs/a0c9/6101073/eb64f638253a/12864_2018_4922_Fig10_HTML.jpg
https://cdn.ncbi.nlm.nih.gov/pmc/blobs/a0c9/6101073/f35a85567d31/12864_2018_4922_Fig11_HTML.jpg
https://cdn.ncbi.nlm.nih.gov/pmc/blobs/a0c9/6101073/64040b526e3e/12864_2018_4922_Fig12_HTML.jpg

相似文献

1
Single cell RNA-seq data clustering using TF-IDF based methods.基于 TF-IDF 的单细胞 RNA-seq 数据聚类方法。
BMC Genomics. 2018 Aug 13;19(Suppl 6):569. doi: 10.1186/s12864-018-4922-4.
2
A multitask clustering approach for single-cell RNA-seq analysis in Recessive Dystrophic Epidermolysis Bullosa.一种用于隐性营养不良型大疱性表皮松解症的单细胞 RNA-seq 分析的多任务聚类方法。
PLoS Comput Biol. 2018 Apr 9;14(4):e1006053. doi: 10.1371/journal.pcbi.1006053. eCollection 2018 Apr.
3
Random forest based similarity learning for single cell RNA sequencing data.基于随机森林的单细胞 RNA 测序数据相似性学习。
Bioinformatics. 2018 Jul 1;34(13):i79-i88. doi: 10.1093/bioinformatics/bty260.
4
Linnorm: improved statistical analysis for single cell RNA-seq expression data.Linnorm:单细胞RNA测序表达数据的改进统计分析
Nucleic Acids Res. 2017 Dec 15;45(22):e179. doi: 10.1093/nar/gkx828.
5
Dimension Reduction and Clustering Models for Single-Cell RNA Sequencing Data: A Comparative Study.降维与聚类模型在单细胞 RNA 测序数据中的应用:一项比较研究。
Int J Mol Sci. 2020 Mar 22;21(6):2181. doi: 10.3390/ijms21062181.
6
A hybrid deep clustering approach for robust cell type profiling using single-cell RNA-seq data.基于单细胞 RNA-seq 数据的混合深度聚类方法进行稳健的细胞类型分析。
RNA. 2020 Oct;26(10):1303-1319. doi: 10.1261/rna.074427.119. Epub 2020 Jun 12.
7
DTWscore: differential expression and cell clustering analysis for time-series single-cell RNA-seq data.DTW分数:时间序列单细胞RNA测序数据的差异表达和细胞聚类分析
BMC Bioinformatics. 2017 May 23;18(1):270. doi: 10.1186/s12859-017-1647-3.
8
Attention-based deep clustering method for scRNA-seq cell type identification.基于注意力机制的深度聚类方法在 scRNA-seq 细胞类型鉴定中的应用。
PLoS Comput Biol. 2023 Nov 10;19(11):e1011641. doi: 10.1371/journal.pcbi.1011641. eCollection 2023 Nov.
9
Data Analysis in Single-Cell Transcriptome Sequencing.单细胞转录组测序中的数据分析
Methods Mol Biol. 2018;1754:311-326. doi: 10.1007/978-1-4939-7717-8_18.
10
DIMM-SC: a Dirichlet mixture model for clustering droplet-based single cell transcriptomic data.DIMM-SC:一种基于 Dirichlet 混合模型的用于聚类基于液滴的单细胞转录组学数据的方法。
Bioinformatics. 2018 Jan 1;34(1):139-146. doi: 10.1093/bioinformatics/btx490.

引用本文的文献

1
Facilitate integrated analysis of single cell multiomic data by binarizing gene expression values.通过对基因表达值进行二值化处理,促进单细胞多组学数据的综合分析。
Nat Commun. 2025 Jul 1;16(1):5763. doi: 10.1038/s41467-025-60899-8.
2
DeepDeconUQ estimates malignant cell fraction prediction intervals in bulk RNA-seq tissue.DeepDeconUQ可估计批量RNA测序组织中的恶性细胞分数预测区间。
PLoS Comput Biol. 2025 Jun 4;21(6):e1013133. doi: 10.1371/journal.pcbi.1013133. eCollection 2025 Jun.
3
Investigating alignment-free machine learning methods for HIV-1 subtype classification.

本文引用的文献

1
Granatum: a graphical single-cell RNA-Seq analysis pipeline for genomics scientists.石榴石:一个用于基因组学科学家的图形单细胞 RNA-Seq 分析流程。
Genome Med. 2017 Dec 5;9(1):108. doi: 10.1186/s13073-017-0492-3.
2
Massively parallel digital transcriptional profiling of single cells.大规模平行数字化单细胞转录组分析。
Nat Commun. 2017 Jan 16;8:14049. doi: 10.1038/ncomms14049.
3
Single-cell transcriptomes identify human islet cell signatures and reveal cell-type-specific expression changes in type 2 diabetes.单细胞转录组鉴定人类胰岛细胞特征并揭示2型糖尿病中细胞类型特异性表达变化。
研究用于HIV-1亚型分类的无比对机器学习方法。
Bioinform Adv. 2024 Jul 29;4(1):vbae108. doi: 10.1093/bioadv/vbae108. eCollection 2024.
4
DeepDecon accurately estimates cancer cell fractions in bulk RNA-seq data.DeepDecon能够准确估计批量RNA测序数据中的癌细胞比例。
Patterns (N Y). 2024 Apr 15;5(5):100969. doi: 10.1016/j.patter.2024.100969. eCollection 2024 May 10.
5
Probabilistic boolean networks predict transcription factor targets to induce transdifferentiation.概率布尔网络预测转录因子靶点以诱导转分化。
iScience. 2022 Aug 17;25(9):104951. doi: 10.1016/j.isci.2022.104951. eCollection 2022 Sep 16.
6
Virally encoded connectivity transgenic overlay RNA sequencing (VECTORseq) defines projection neurons involved in sensorimotor integration.病毒编码连接性转基因覆盖 RNA 测序 (VECTORseq) 定义了参与感觉运动整合的投射神经元。
Cell Rep. 2021 Dec 21;37(12):110131. doi: 10.1016/j.celrep.2021.110131.
7
Reversion analysis reveals the in vivo immunogenicity of a poorly MHC I-binding cancer neoepitope.回复分析揭示了一种 MHC I 结合能力差的癌症新抗原的体内免疫原性。
Nat Commun. 2021 Nov 5;12(1):6423. doi: 10.1038/s41467-021-26646-5.
8
Patterns, Profiles, and Parsimony: Dissecting Transcriptional Signatures From Minimal Single-Cell RNA-Seq Output With SALSA.模式、概况与简约性:利用SALSA从最小单细胞RNA测序输出中剖析转录特征
Front Genet. 2020 Oct 9;11:511286. doi: 10.3389/fgene.2020.511286. eCollection 2020.
9
Modeling aspects of the language of life through transfer-learning protein sequences.通过转移学习蛋白质序列来模拟生命语言的各个方面。
BMC Bioinformatics. 2019 Dec 17;20(1):723. doi: 10.1186/s12859-019-3220-8.
10
Cross-Species Analysis of Single-Cell Transcriptomic Data.单细胞转录组数据的跨物种分析
Front Cell Dev Biol. 2019 Sep 2;7:175. doi: 10.3389/fcell.2019.00175. eCollection 2019.
Genome Res. 2017 Feb;27(2):208-222. doi: 10.1101/gr.212720.116. Epub 2016 Nov 18.
4
Single-Cell Transcriptome Profiling of Human Pancreatic Islets in Health and Type 2 Diabetes.健康与2型糖尿病状态下人类胰岛的单细胞转录组分析
Cell Metab. 2016 Oct 11;24(4):593-607. doi: 10.1016/j.cmet.2016.08.020. Epub 2016 Sep 22.
5
Detection of high variability in gene expression from single-cell RNA-seq profiling.从单细胞RNA测序分析中检测基因表达的高变异性。
BMC Genomics. 2016 Aug 22;17 Suppl 7(Suppl 7):508. doi: 10.1186/s12864-016-2897-6.
6
Mash: fast genome and metagenome distance estimation using MinHash.Mash:使用MinHash进行快速的基因组和宏基因组距离估计。
Genome Biol. 2016 Jun 20;17(1):132. doi: 10.1186/s13059-016-0997-x.
7
Classification of low quality cells from single-cell RNA-seq data.从单细胞RNA测序数据中对低质量细胞进行分类。
Genome Biol. 2016 Feb 17;17:29. doi: 10.1186/s13059-016-0888-1.
8
Spatial reconstruction of single-cell gene expression data.单细胞基因表达数据的空间重建
Nat Biotechnol. 2015 May;33(5):495-502. doi: 10.1038/nbt.3192. Epub 2015 Apr 13.
9
Computational analysis of cell-to-cell heterogeneity in single-cell RNA-sequencing data reveals hidden subpopulations of cells.单细胞 RNA 测序数据中细胞间异质性的计算分析揭示了细胞的隐藏亚群。
Nat Biotechnol. 2015 Feb;33(2):155-60. doi: 10.1038/nbt.3102. Epub 2015 Jan 19.
10
Inferring ethnicity from mitochondrial DNA sequence.从线粒体DNA序列推断种族。
BMC Proc. 2011 May 28;5 Suppl 2(Suppl 2):S11. doi: 10.1186/1753-6561-5-S2-S11.