Ledolter Johannes, Kardon Randy H
Department of Management Sciences at the University of Iowa, Iowa City, IA, USA.
Iowa City VA Medical Center, Iowa City, IA, USA.
Transl Vis Sci Technol. 2018 Oct 31;7(5):34. doi: 10.1167/tvst.7.5.34. eCollection 2018 Sep.
Clinical decisions on treatment are usually based on short-term records of consecutive measurements of structure and function. Useful models for analyzing average trends and a description of statistical methods for classifying individual subjects on the basis of subject-specific trend progressions are presented.
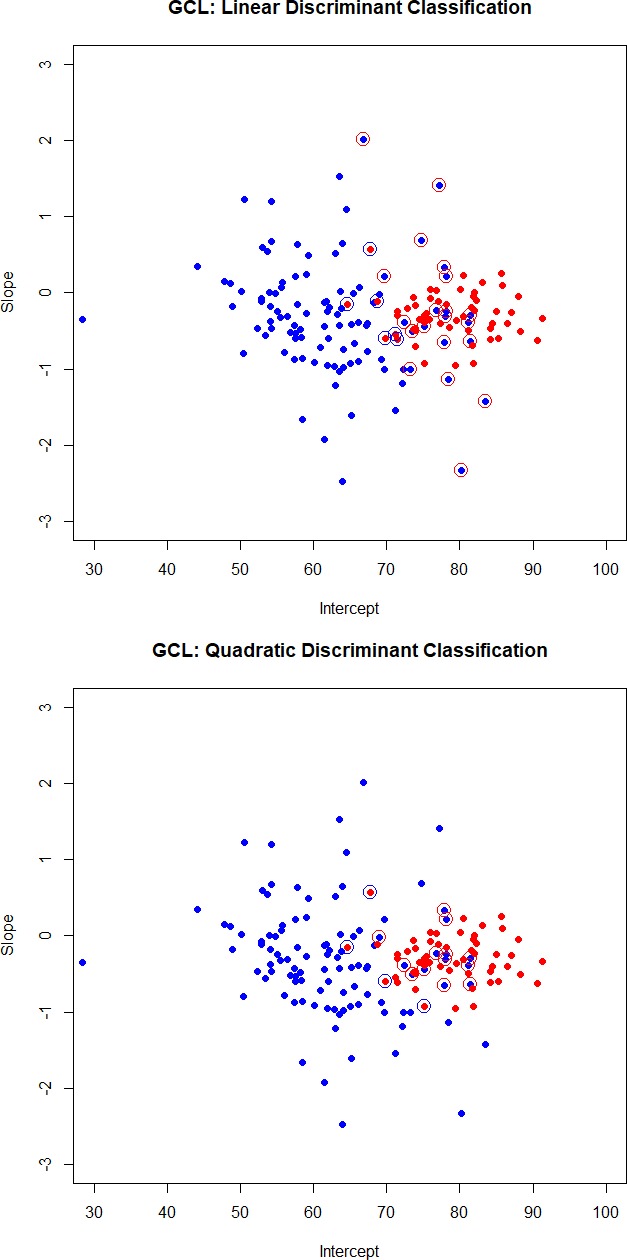
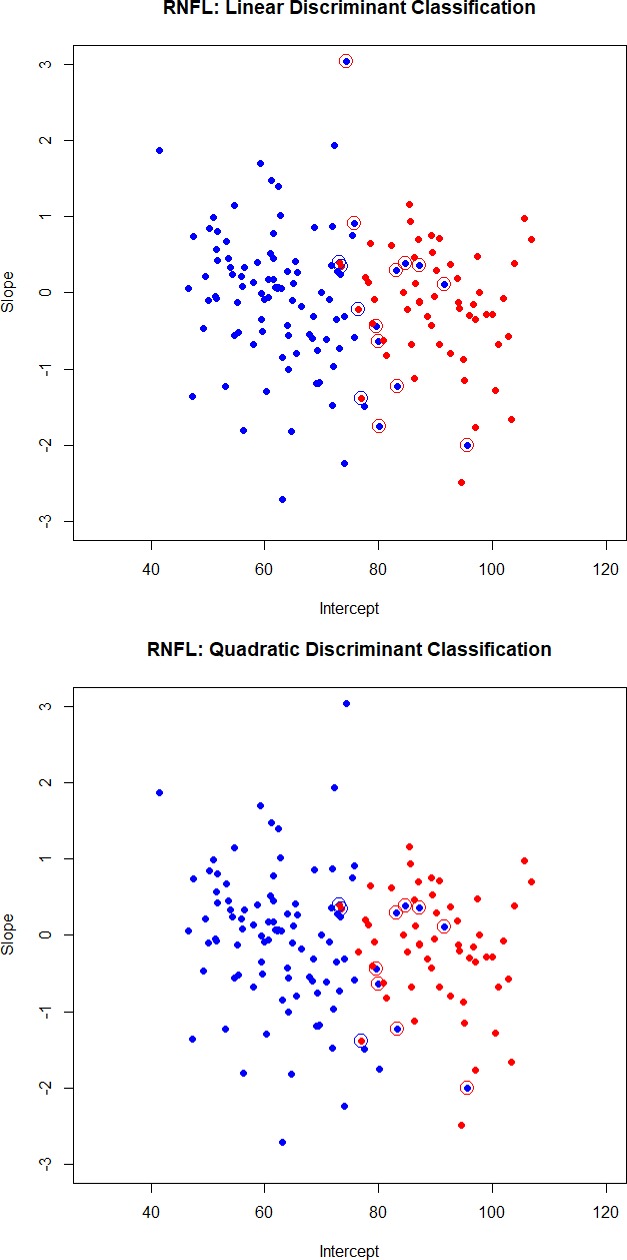
Random effects trend models allow intercepts and slopes of the trend regression to vary across subjects around group-specific mean intercepts and mean slopes. Model results assess whether average intercepts and slopes and subject variability in intercepts and slopes are the same across groups. Fisher's discriminant functions are used for classification.
Methods are presented and illustrated on structural visual data from a multiyear perimetry study. Average thickness of the ganglion cell layer from the optical coherence tomography macula scan and of the retinal nerve fiber layer from the optic disc scan for both glaucoma patients on optimal treatment and normal subjects are analyzed. The random effects trend model shows that average intercepts of glaucoma patients and normal subjects are quite different, but that average slopes are the same, and that the subject variability in both intercepts and slopes is larger for the glaucoma group. These findings explain why the subject-specific trend progression is not a good classifier; it is the level of the measurement (intercept or baseline value) that carries useful information in this particular cohort example.
Clinicians base decisions on short-term records of consecutive measurements and need simple statistical tools to analyze the information. This paper discusses useful methods for analyzing short time series data. Model results assess whether there exist significant trends and whether average trends are different across groups. The paper discusses whether clinical measures classify patients reliably into disease groups, given their variability. With ever more available data, classification plays a central role of personalized medicine.
治疗方面的临床决策通常基于对结构和功能的连续测量的短期记录。本文提出了用于分析平均趋势的有用模型,以及基于个体特定趋势进展对个体受试者进行分类的统计方法描述。
随机效应趋势模型允许趋势回归的截距和斜率在特定组的平均截距和平均斜率周围因受试者而异。模型结果评估不同组之间的平均截距、斜率以及截距和斜率的受试者变异性是否相同。使用费舍尔判别函数进行分类。
本文介绍并举例说明了来自多年视野检查研究的结构视觉数据的方法。分析了接受最佳治疗的青光眼患者和正常受试者的光学相干断层扫描黄斑扫描的神经节细胞层平均厚度以及视盘扫描的视网膜神经纤维层平均厚度。随机效应趋势模型显示,青光眼患者和正常受试者的平均截距有很大差异,但平均斜率相同,并且青光眼组在截距和斜率方面的受试者变异性更大。这些发现解释了为什么个体特定趋势进展不是一个好的分类器;在这个特定的队列示例中,是测量水平(截距或基线值)携带了有用信息。
临床医生基于连续测量的短期记录做出决策,并且需要简单的统计工具来分析这些信息。本文讨论了分析短时间序列数据的有用方法。模型结果评估是否存在显著趋势以及不同组之间的平均趋势是否不同。本文讨论了考虑到临床测量的变异性,它们是否能可靠地将患者分类到疾病组中。随着可用数据越来越多,分类在个性化医疗中起着核心作用。