Zhao Shitao, Sun Jianqiang, Shimizu Kentaro, Kadota Koji
Graduate School of Agricultural and Life Sciences, The University of Tokyo, 1-1-1 Yayoi, Bunkyo-ku, Tokyo, 113-8657 Japan.
Biol Proced Online. 2018 Mar 1;20:5. doi: 10.1186/s12575-018-0067-8. eCollection 2018.
Hierarchical Sample clustering (HSC) is widely performed to examine associations within expression data obtained from microarrays and RNA sequencing (RNA-seq). Researchers have investigated the HSC results with several possible criteria for grouping (e.g., sex, age, and disease types). However, the evaluation of arbitrary defined groups still counts in subjective visual inspection.
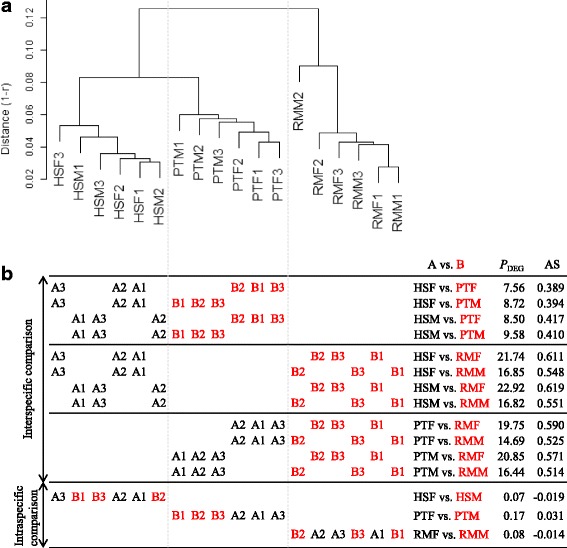
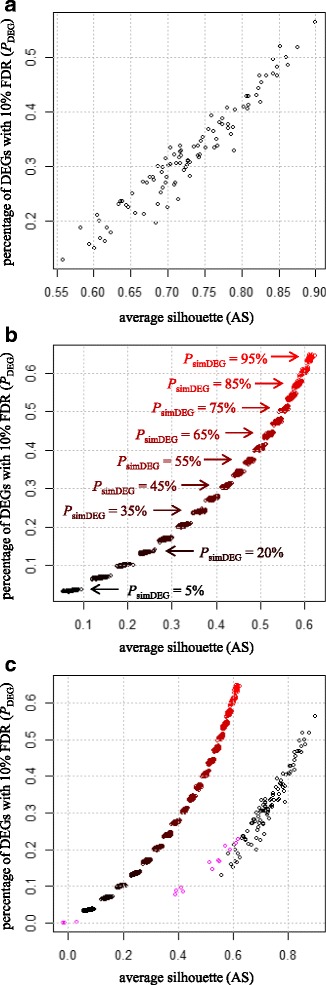
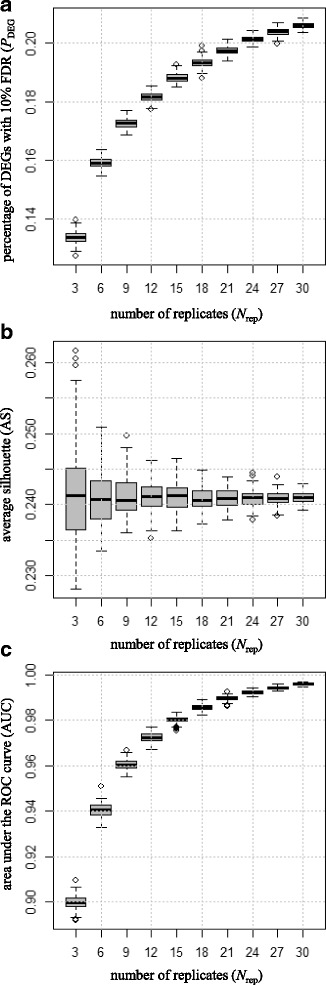
To objectively evaluate the degree of separation between groups of interest in the HSC dendrogram, we propose to use scores. Silhouettes was originally developed as a graphical aid for the validation of data clusters. It provides a measure of how well a sample is classified when it was assigned to a cluster by according to both the tightness of the clusters and the separation between them. It ranges from 1.0 to - 1.0, and a larger value for the average silhouette (AS) over all samples to be analyzed indicates a higher degree of separation. The basic idea to use an AS is to replace the term by when calculating the scores. We investigated the validity of this score using simulated and real data designed for differential expression (DE) analysis. We found that larger (or smaller) AS values agreed well with both higher (or lower) degrees of separation between different groups and higher percentages of differentially expressed genes (). We also found that the AS values were generally independent on the number of replicates (). Although the values depended on , we confirmed that both AS and values were close to zero when samples in the data showed an intermingled nature between the groups in the HSC dendrogram.
Silhouettes is useful for exploring data with predefined group labels. It would help provide both an objective evaluation of HSC dendrograms and insights into the DE results with regard to the compared groups.
层次样本聚类(HSC)被广泛用于检查从微阵列和RNA测序(RNA-seq)获得的表达数据中的关联。研究人员已经用几种可能的分组标准(如性别、年龄和疾病类型)来研究HSC结果。然而,对任意定义组的评估仍然依赖主观的视觉检查。
为了客观评估HSC树状图中感兴趣组之间的分离程度,我们建议使用轮廓系数。轮廓系数最初是作为一种用于验证数据聚类的图形辅助工具而开发的。它提供了一种衡量样本在根据聚类的紧密程度和它们之间的分离程度被分配到一个聚类时被分类得有多好的方法。它的范围从1.0到-1.0,并且对于所有要分析的样本,平均轮廓系数(AS)的值越大表明分离程度越高。使用AS的基本思想是在计算轮廓系数时用AS代替轮廓系数。我们使用为差异表达(DE)分析设计的模拟数据和真实数据研究了这个分数的有效性。我们发现较大(或较小)的AS值与不同组之间较高(或较低)的分离程度以及较高(或较低)的差异表达基因百分比(DEGs)都很好地吻合。我们还发现AS值通常与重复次数(n)无关。尽管DEG值依赖于n,但我们证实当数据中的样本在HSC树状图中显示出组间混合的性质时,AS和DEG值都接近于零。
轮廓系数对于探索带有预定义组标签的数据很有用。它将有助于对HSC树状图进行客观评估,并深入了解关于比较组的DE结果。