Nutrition and Dietetics Group, School of Life and Environmental Science, Charles Perkins Centre, The University of Sydney, NSW 2006, Australia.
Nutrients. 2019 Mar 14;11(3):621. doi: 10.3390/nu11030621.
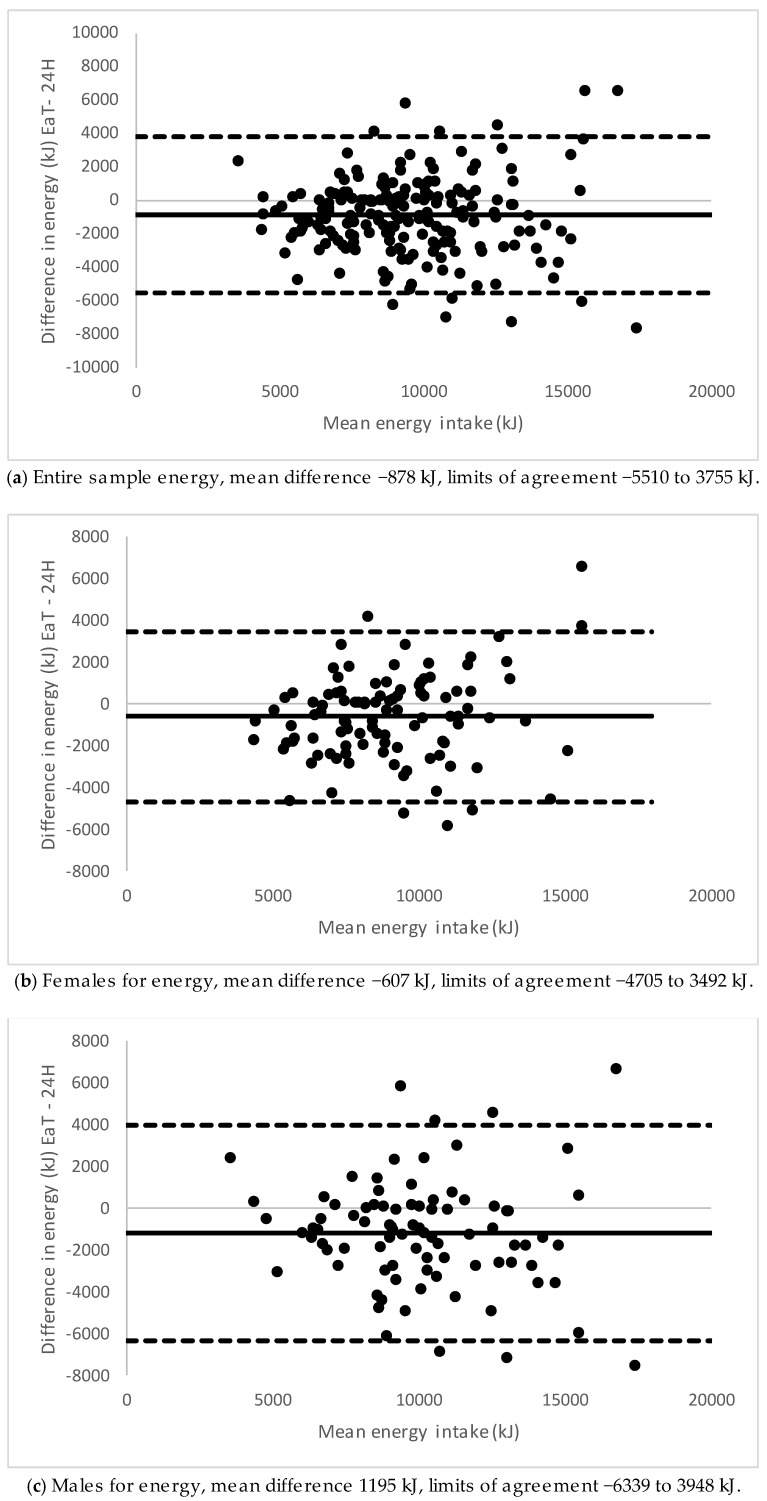
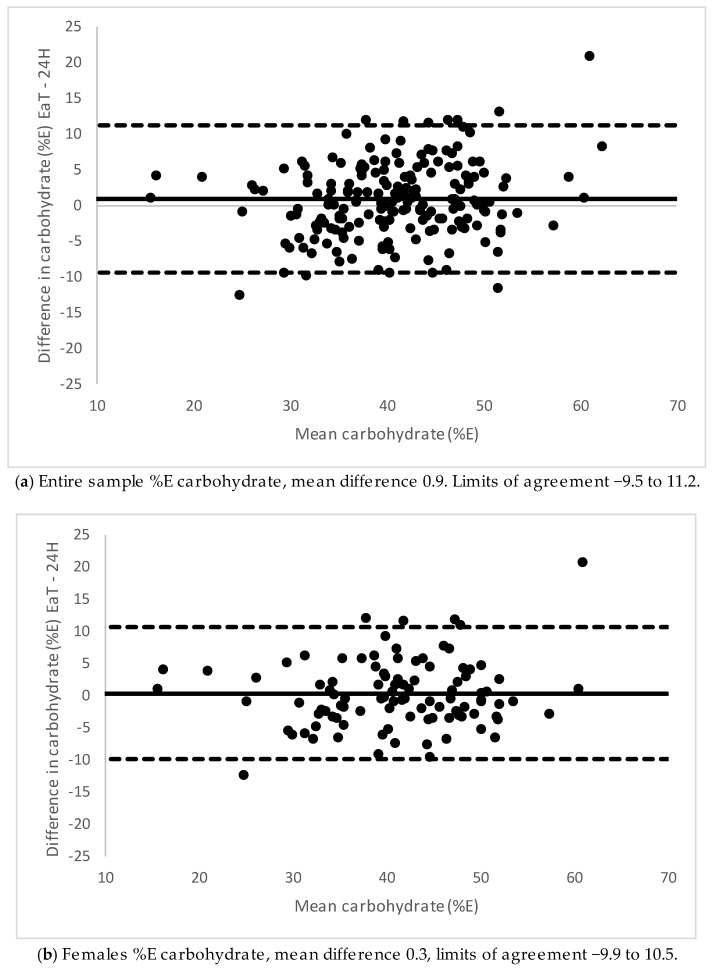
(1) Background: Smartphone dietary assessment apps can be acceptable and valid data collection methods but have predominantly been validated in highly educated women, and none specifically measured eating-out habits in young adults. (2) Methods: Participants recorded their food and beverage consumption for three days using the Eat and Track (EaT) app, and intakes were compared with three dietitian-administered 24-h recall interviews matched to the same days as the reference method. Wilcoxon signed-rank or -tests, correlation coefficients and Bland⁻Altman plots assessed agreement between the two methods for energy and percentage energy from nutrients (%E). (3) Results: One hundred and eighty nine of 216 participants (54% females, 60% resided in higher socioeconomic areas, 49% university-educated) completed the study. There were significant differences in median energy intake between methods ( < 0.001), but the EaT app had acceptable agreement for most nutrient densities at the group level. Correlation coefficients ranged from r = 0.56 (%E fat) to 0.82 (%E sugars), and between 85% and 94% of participants were cross-classified into the same or adjacent quartiles. Bland⁻Altman plots showed wide limits of agreement but no obvious biases for nutrient densities except carbohydrate in males. (4) Conclusions: The EaT app can be used to assess group nutrient densities in a general population of 18-to-30-year olds.
(1) 背景:智能手机饮食评估应用程序可以作为可接受和有效的数据收集方法,但主要在受教育程度较高的女性中得到验证,并且没有专门针对年轻人的外出就餐习惯进行测量。(2) 方法:参与者使用 Eat and Track (EaT) 应用程序记录三天的食物和饮料摄入量,并将摄入量与三位营养师管理的 24 小时回忆访谈进行比较,这些访谈与参考方法相同的天数相对应。Wilcoxon 符号秩或 -检验、相关系数和 Bland⁻Altman 图评估了两种方法在能量和营养素能量百分比(%E)方面的一致性。(3) 结果:189 名 216 名参与者中的 189 名(54%为女性,60%居住在较高社会经济地区,49%受过大学教育)完成了研究。两种方法的中位能量摄入量存在显著差异(<0.001),但 EaT 应用程序在群体水平上对大多数营养素密度具有可接受的一致性。相关系数范围从 r = 0.56(%E 脂肪)到 0.82(%E 糖),85%至 94%的参与者被交叉分类为相同或相邻的四分位数。Bland⁻Altman 图显示了除男性碳水化合物外,大多数营养素密度的一致性界限较宽,但没有明显的偏差。(4) 结论:EaT 应用程序可用于评估 18 至 30 岁一般人群的营养素密度。