• 文献检索
  • 文档翻译
  • 深度研究
  • 学术资讯
  • Suppr Zotero 插件Zotero 插件
  • 邀请有礼
  • 套餐&价格
  • 历史记录
应用&插件
Suppr Zotero 插件Zotero 插件浏览器插件Mac 客户端Windows 客户端微信小程序
定价
高级版会员购买积分包购买API积分包
服务
文献检索文档翻译深度研究API 文档MCP 服务
关于我们
关于 Suppr公司介绍联系我们用户协议隐私条款
关注我们

Suppr 超能文献

核心技术专利:CN118964589B侵权必究
粤ICP备2023148730 号-1Suppr @ 2026

文献检索

告别复杂PubMed语法,用中文像聊天一样搜索,搜遍4000万医学文献。AI智能推荐,让科研检索更轻松。

立即免费搜索

文件翻译

保留排版,准确专业,支持PDF/Word/PPT等文件格式,支持 12+语言互译。

免费翻译文档

深度研究

AI帮你快速写综述,25分钟生成高质量综述,智能提取关键信息,辅助科研写作。

立即免费体验

结合两个国家级数据集绘制土壤属性图:以英格兰和威尔士的有效镁为例。

Combining two national-scale datasets to map soil properties, the case of available magnesium in England and Wales.

作者信息

Lark R M, Ander E L, Broadley M R

机构信息

School of Biosciences, University of Nottingham, Sutton Bonington, Nottinghamshire LE12 5RD UK.

British Geological Survey Keyworth, Nottinghamshire NG12 5GG UK.

出版信息

Eur J Soil Sci. 2019 Mar;70(2):361-377. doi: 10.1111/ejss.12743. Epub 2018 Nov 23.

DOI:10.1111/ejss.12743
PMID:30983873
原文链接:https://pmc.ncbi.nlm.nih.gov/articles/PMC6446813/
Abstract

UNLABELLED

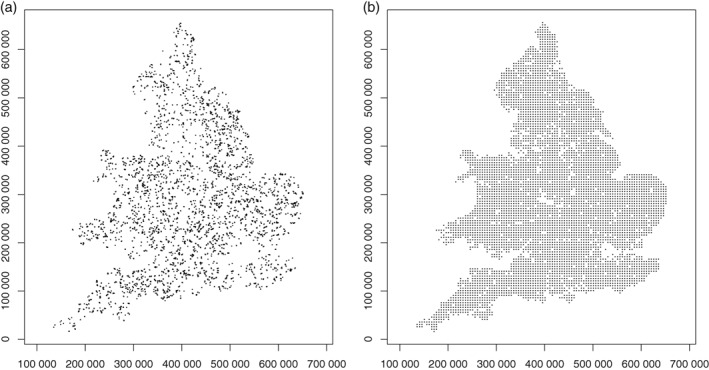
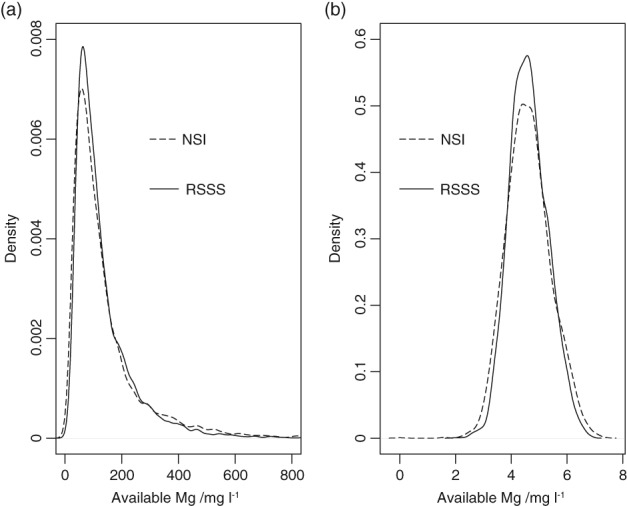
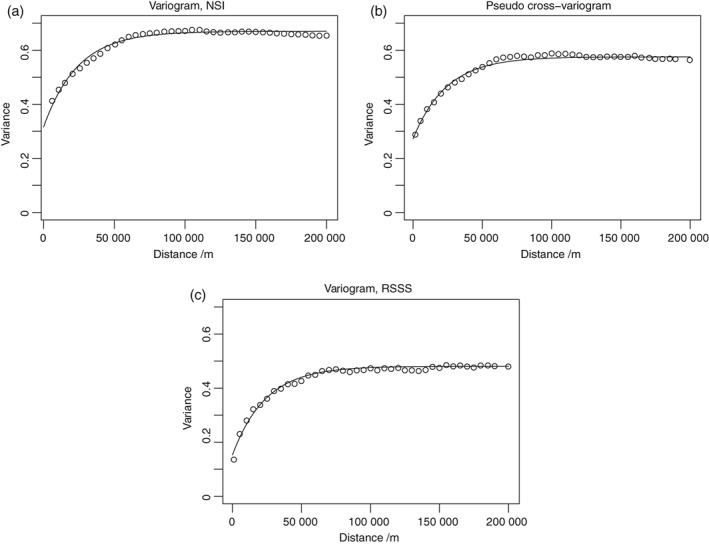
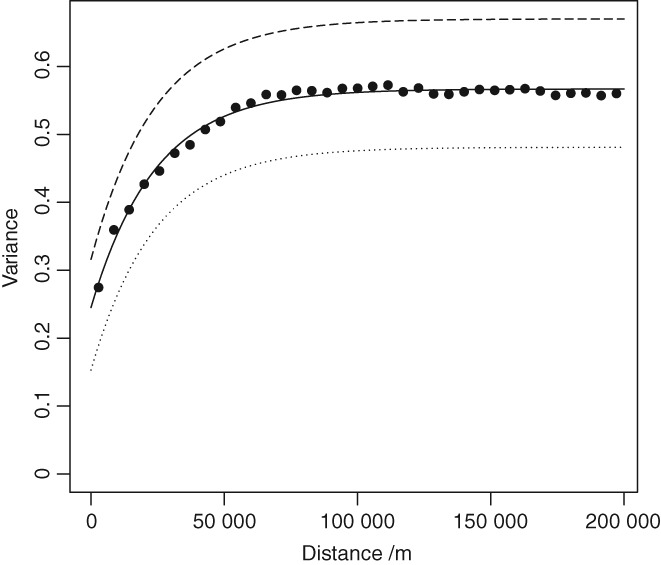
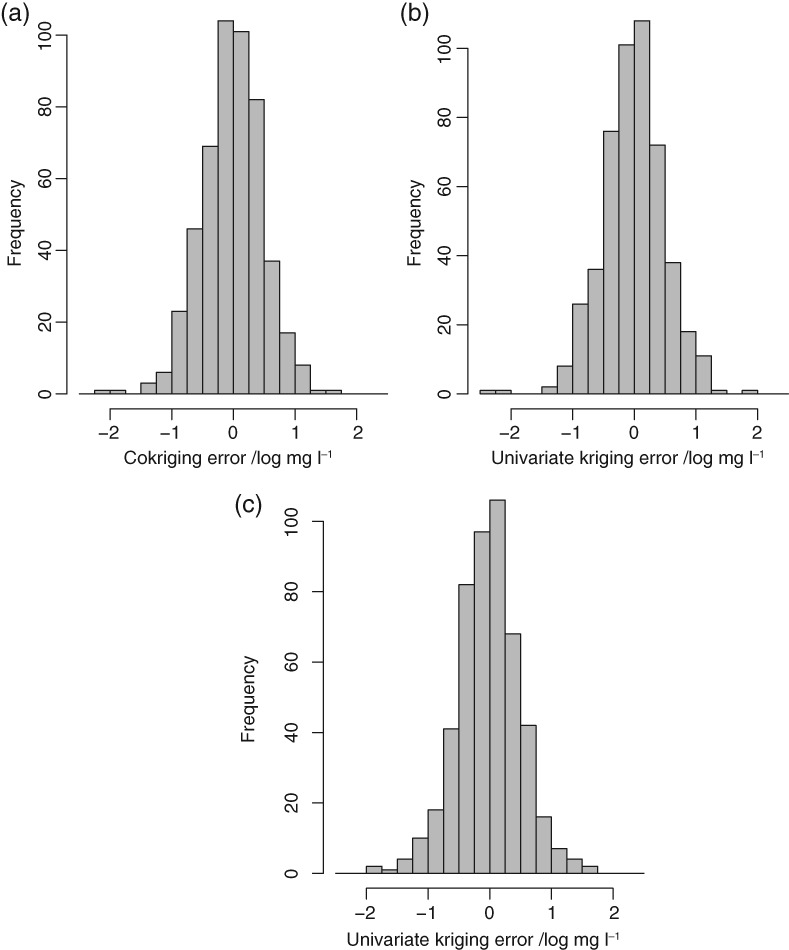
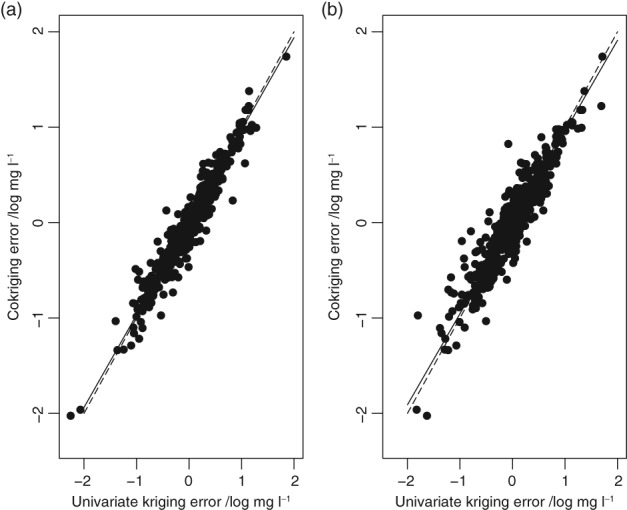
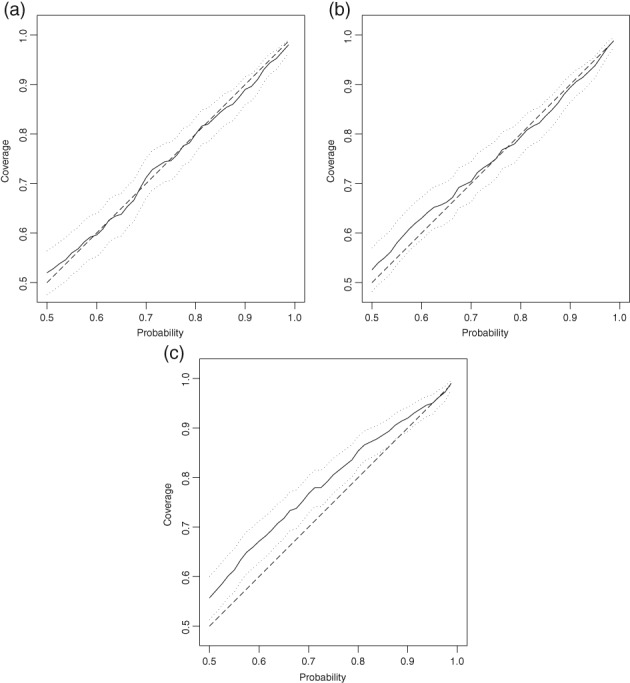
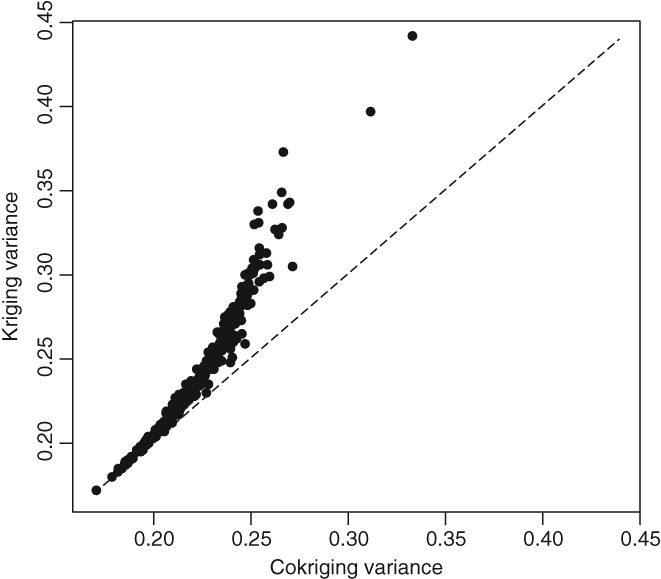
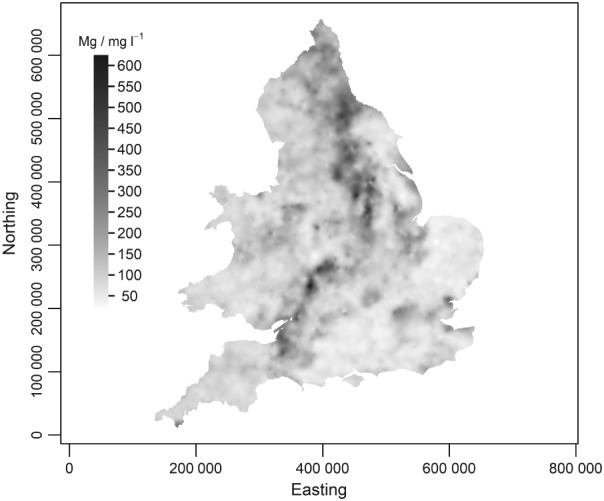
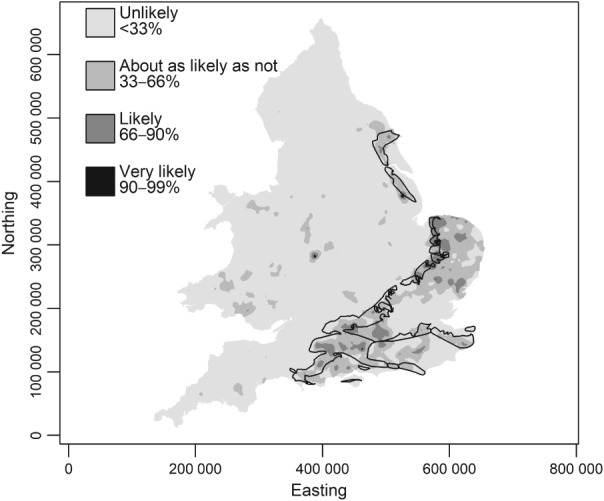
Given the costs of soil survey it is necessary to make the best use of available datasets, but data that differ with respect to some aspect of the sampling or analytical protocol cannot be combined simply. In this paper we consider a case where two datasets were available on the concentration of plant-available magnesium in the topsoil. The datasets were the Representative Soil Sampling Scheme (RSSS) and the National Soil Inventory (NSI) of England and Wales. The variable was measured over the same depth interval and with the same laboratory method, but the sample supports were different and so the datasets differ in their variance. We used a multivariate geostatistical model, the linear model of coregionalization (LMCR), to model the joint spatial distribution of the two datasets. The model allowed us to elucidate the effects of the sample support on the two datasets, and to show that there was a strong correlation between the underlying variables. The LMCR allowed us to make spatial predictions of the variable on the RSSS support by cokriging the RSSS data with the NSI data. We used cross-validation to test the validity of the LMCR and showed how incorporating the NSI data restricted the range of prediction error variances relative to univariate ordinary kriging predictions from the RSSS data alone. The standardized squared prediction errors were computed and the coverage of prediction intervals (i.e. the proportion of sites at which the prediction interval included the observed value of the variable). Both these statistics suggested that the prediction error variances were consistent for the cokriging predictions but not for the ordinary kriging predictions from the simple combination of the RSSS and NSI data, which might be proposed on the basis of their very similar mean values. The LMCR is therefore proposed as a general tool for the combined analysis of different datasets on soil properties.

HIGHLIGHTS

Differences in sample support mean that two datasets on a soil property cannot be combined simply.We showed how a multivariate geostatistical model can be used to elucidate the relationships between two such datasets.The same model allows soil properties to be mapped jointly from such data.This offers a general basis for combining soil datasets from diverse sources.

摘要

未标注

鉴于土壤调查的成本,有必要充分利用现有的数据集,但在采样或分析方案的某些方面存在差异的数据不能简单地合并。在本文中,我们考虑了一个案例,其中有两个关于表土中植物可利用镁浓度的数据集。这两个数据集分别是英格兰和威尔士的代表性土壤采样方案(RSSS)和国家土壤清单(NSI)。该变量是在相同的深度区间内使用相同的实验室方法测量的,但样本支撑不同,因此数据集的方差也不同。我们使用了一个多元地质统计模型,即协同区域化线性模型(LMCR),来模拟这两个数据集的联合空间分布。该模型使我们能够阐明样本支撑对这两个数据集的影响,并表明潜在变量之间存在很强的相关性。通过将RSSS数据与NSI数据进行协同克里金法,LMCR使我们能够对RSSS支撑上的变量进行空间预测。我们使用交叉验证来测试LMCR的有效性,并展示了纳入NSI数据相对于仅使用RSSS数据的单变量普通克里金法预测如何限制预测误差方差的范围。计算了标准化平方预测误差和预测区间的覆盖率(即预测区间包含变量观测值的站点比例)。这两个统计数据都表明,协同克里金法预测的预测误差方差是一致的,但对于基于RSSS和NSI数据非常相似的平均值可能提出的简单组合的普通克里金法预测则不然。因此,LMCR被提议作为对不同土壤属性数据集进行综合分析的通用工具。

重点

样本支撑的差异意味着关于土壤属性的两个数据集不能简单地合并。我们展示了如何使用多元地质统计模型来阐明两个这样的数据集之间的关系。相同的模型允许从这些数据中联合绘制土壤属性图。这为合并来自不同来源的土壤数据集提供了一个通用基础。

https://cdn.ncbi.nlm.nih.gov/pmc/blobs/0849/6446813/5ca881528040/EJSS-70-361-g012.jpg
https://cdn.ncbi.nlm.nih.gov/pmc/blobs/0849/6446813/9a5e7184451b/EJSS-70-361-g001.jpg
https://cdn.ncbi.nlm.nih.gov/pmc/blobs/0849/6446813/9b14d09fbf3d/EJSS-70-361-g002.jpg
https://cdn.ncbi.nlm.nih.gov/pmc/blobs/0849/6446813/0b4fe0d4915a/EJSS-70-361-g003.jpg
https://cdn.ncbi.nlm.nih.gov/pmc/blobs/0849/6446813/f65a97a00da4/EJSS-70-361-g004.jpg
https://cdn.ncbi.nlm.nih.gov/pmc/blobs/0849/6446813/38bb19bae4fa/EJSS-70-361-g005.jpg
https://cdn.ncbi.nlm.nih.gov/pmc/blobs/0849/6446813/b4bb5fdd02b8/EJSS-70-361-g006.jpg
https://cdn.ncbi.nlm.nih.gov/pmc/blobs/0849/6446813/d16e5fe3f28c/EJSS-70-361-g007.jpg
https://cdn.ncbi.nlm.nih.gov/pmc/blobs/0849/6446813/0d1e64215941/EJSS-70-361-g008.jpg
https://cdn.ncbi.nlm.nih.gov/pmc/blobs/0849/6446813/9dcfd2d460cc/EJSS-70-361-g009.jpg
https://cdn.ncbi.nlm.nih.gov/pmc/blobs/0849/6446813/7d0f970fccd4/EJSS-70-361-g010.jpg
https://cdn.ncbi.nlm.nih.gov/pmc/blobs/0849/6446813/2ed90514f0ca/EJSS-70-361-g011.jpg
https://cdn.ncbi.nlm.nih.gov/pmc/blobs/0849/6446813/5ca881528040/EJSS-70-361-g012.jpg

相似文献

1
Combining two national-scale datasets to map soil properties, the case of available magnesium in England and Wales.结合两个国家级数据集绘制土壤属性图:以英格兰和威尔士的有效镁为例。
Eur J Soil Sci. 2019 Mar;70(2):361-377. doi: 10.1111/ejss.12743. Epub 2018 Nov 23.
2
A geostatistical approach for multi-source data fusion to predict water table depth.基于地统计学的多源数据融合方法预测地下水位深度。
Sci Total Environ. 2019 Dec 15;696:133763. doi: 10.1016/j.scitotenv.2019.133763. Epub 2019 Aug 16.
3
Kriging methods with auxiliary nighttime lights data to detect potentially toxic metals concentrations in soil.克里金法结合夜间灯光辅助数据探测土壤中潜在有毒金属浓度。
Sci Total Environ. 2019 Apr 1;659:363-371. doi: 10.1016/j.scitotenv.2018.12.330. Epub 2018 Dec 22.
4
Selecting optimal calibration samples using proximal sensing EM induction and γ-ray spectrometry data: An application to managing lime and magnesium in sugarcane growing soil.利用近感电磁感应和伽马射线光谱数据选择最佳校准样本:在甘蔗生长土壤石灰和镁管理中的应用。
J Environ Manage. 2021 Oct 15;296:113357. doi: 10.1016/j.jenvman.2021.113357. Epub 2021 Jul 28.
5
Mapping soil gas radon concentration: a comparative study of geostatistical methods.绘制土壤气体氡浓度图:地统计方法的比较研究
Environ Monit Assess. 2007 Aug;131(1-3):135-51. doi: 10.1007/s10661-006-9463-7. Epub 2007 Jan 23.
6
Enhancing spatial estimates of metal pollutants in raw wastewater irrigated fields using a topsoil organic carbon map predicted from aerial photography.利用航空摄影预测的表土有机碳图增强原生污水灌溉农田中金属污染物的空间估计。
Sci Total Environ. 2006 May 15;361(1-3):229-48. doi: 10.1016/j.scitotenv.2005.05.011. Epub 2005 Jul 1.
7
Combining Areal and Point Data in Geostatistical Interpolation: Applications to Soil Science and Medical Geography.地统计插值中面状数据与点状数据的结合:在土壤科学和医学地理学中的应用
Math Geosci. 2010 Jul 1;42(5):535-554. doi: 10.1007/s11004-010-9286-5.
8
A coherent geostatistical approach for combining choropleth map and field data in the spatial interpolation of soil properties.一种在土壤属性空间插值中结合分级统计图和实地数据的连贯地质统计学方法。
Eur J Soil Sci. 2011 Jun;62(3):371-380. doi: 10.1111/j.1365-2389.2011.01368.x.
9
[Kriging prediction of soil zinc in contaminated field by using an auxiliary variable].利用辅助变量对污染场地土壤锌进行克里金预测
Ying Yong Sheng Tai Xue Bao. 2006 Jan;17(1):97-101.
10
Multivariate Poisson cokriging: A geostatistical model for health count data.多元泊松协克里金法:一种用于健康计数数据的地质统计学模型。
Stat Methods Med Res. 2024 Sep;33(9):1637-1659. doi: 10.1177/09622802241268488. Epub 2024 Aug 14.

引用本文的文献

1
Building a resilient and sustainable food system in a changing world - A case for climate-smart and nutrient dense crops.在不断变化的世界中构建有韧性且可持续的粮食系统——以气候智能型和营养密集型作物为例
Glob Food Sec. 2021 Mar;28. doi: 10.1016/j.gfs.2020.100477. Epub 2020 Dec 16.
2
A spatial analysis of lime resources and their potential for improving soil magnesium concentrations and pH in grassland areas of England and Wales.英格兰和威尔士草原地区石灰资源的空间分析及其对提高土壤镁浓度和 pH 值的潜力。
Sci Rep. 2021 Oct 14;11(1):20420. doi: 10.1038/s41598-021-98735-w.
3
Boundary line models for soil nutrient concentrations and wheat yield in national-scale datasets.

本文引用的文献

1
Improving communication of uncertainty in the reports of the intergovernmental panel on climate change.改善政府间气候变化专门委员会报告中不确定性信息的传达。
Psychol Sci. 2009 Mar;20(3):299-308. doi: 10.1111/j.1467-9280.2009.02284.x. Epub 2009 Jan 30.
国家尺度数据集中土壤养分浓度与小麦产量的边界线模型
Eur J Soil Sci. 2020 May;71(3):334-351. doi: 10.1111/ejss.12891. Epub 2019 Nov 15.
4
Spatial prediction of the concentration of selenium (Se) in grain across part of Amhara Region, Ethiopia.埃塞俄比亚阿姆哈拉地区部分地区谷物中硒(Se)浓度的空间预测。
Sci Total Environ. 2020 Sep 1;733:139231. doi: 10.1016/j.scitotenv.2020.139231. Epub 2020 May 12.
5
A reconnaissance survey of farmers' awareness of hypomagnesaemic tetany in UK cattle and sheep farms.英国牛羊养殖场农民对低镁血症性搐搦症认知的调查研究
PLoS One. 2019 Oct 11;14(10):e0223868. doi: 10.1371/journal.pone.0223868. eCollection 2019.
6
The risk of selenium deficiency in Malawi is large and varies over multiple spatial scales.马拉维硒缺乏的风险很大,并且存在多种空间尺度的差异。
Sci Rep. 2019 Apr 25;9(1):6566. doi: 10.1038/s41598-019-43013-z.