• 文献检索
  • 文档翻译
  • 深度研究
  • 学术资讯
  • Suppr Zotero 插件Zotero 插件
  • 邀请有礼
  • 套餐&价格
  • 历史记录
应用&插件
Suppr Zotero 插件Zotero 插件浏览器插件Mac 客户端Windows 客户端微信小程序
定价
高级版会员购买积分包购买API积分包
服务
文献检索文档翻译深度研究API 文档MCP 服务
关于我们
关于 Suppr公司介绍联系我们用户协议隐私条款
关注我们

Suppr 超能文献

核心技术专利:CN118964589B侵权必究
粤ICP备2023148730 号-1Suppr @ 2026

文献检索

告别复杂PubMed语法,用中文像聊天一样搜索,搜遍4000万医学文献。AI智能推荐,让科研检索更轻松。

立即免费搜索

文件翻译

保留排版,准确专业,支持PDF/Word/PPT等文件格式,支持 12+语言互译。

免费翻译文档

深度研究

AI帮你快速写综述,25分钟生成高质量综述,智能提取关键信息,辅助科研写作。

立即免费体验

STEM能谱X射线能谱图像的最优主成分分析

Optimal principal component analysis of STEM XEDS spectrum images.

作者信息

Potapov Pavel, Lubk Axel

机构信息

1Department of Physics, Technical University of Dresden, Dresden, Germany.

2Leibniz Institute for Solid State and Materials Research (IFW), Dresden, Germany.

出版信息

Adv Struct Chem Imaging. 2019;5(1):4. doi: 10.1186/s40679-019-0066-0. Epub 2019 Apr 9.

DOI:10.1186/s40679-019-0066-0
PMID:31032174
原文链接:https://pmc.ncbi.nlm.nih.gov/articles/PMC6456488/
Abstract

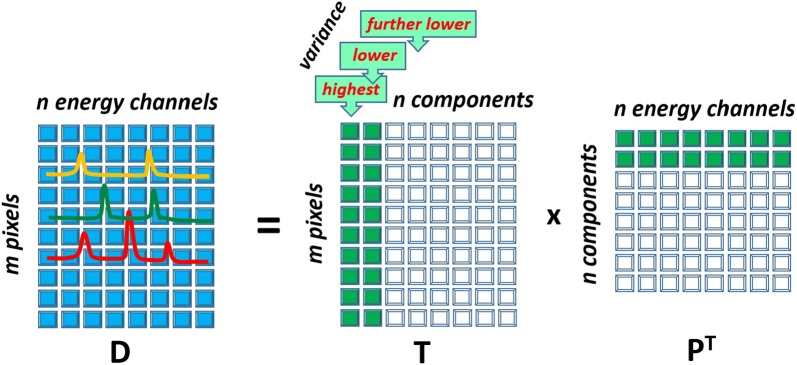
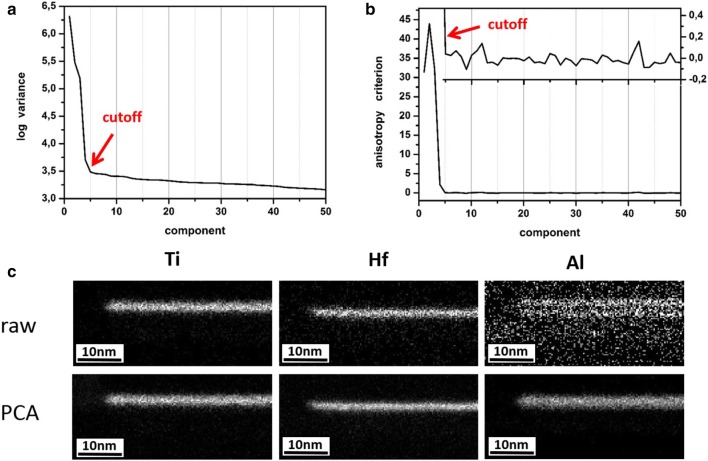
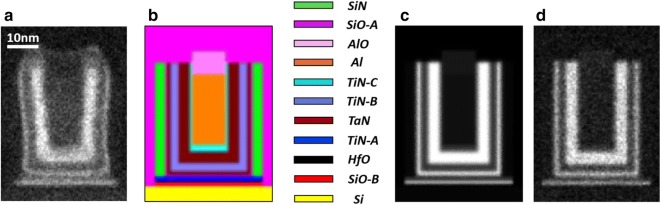
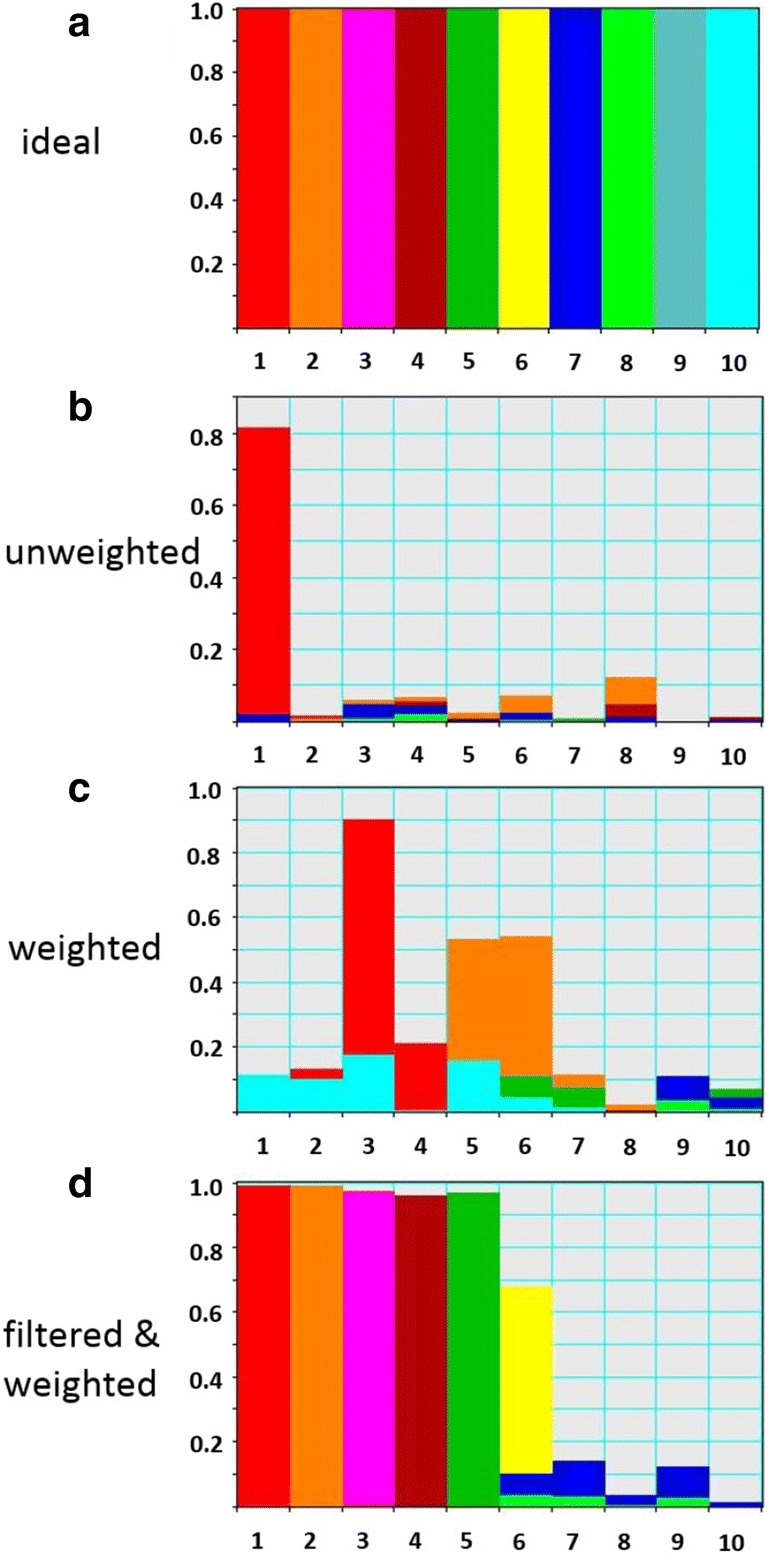
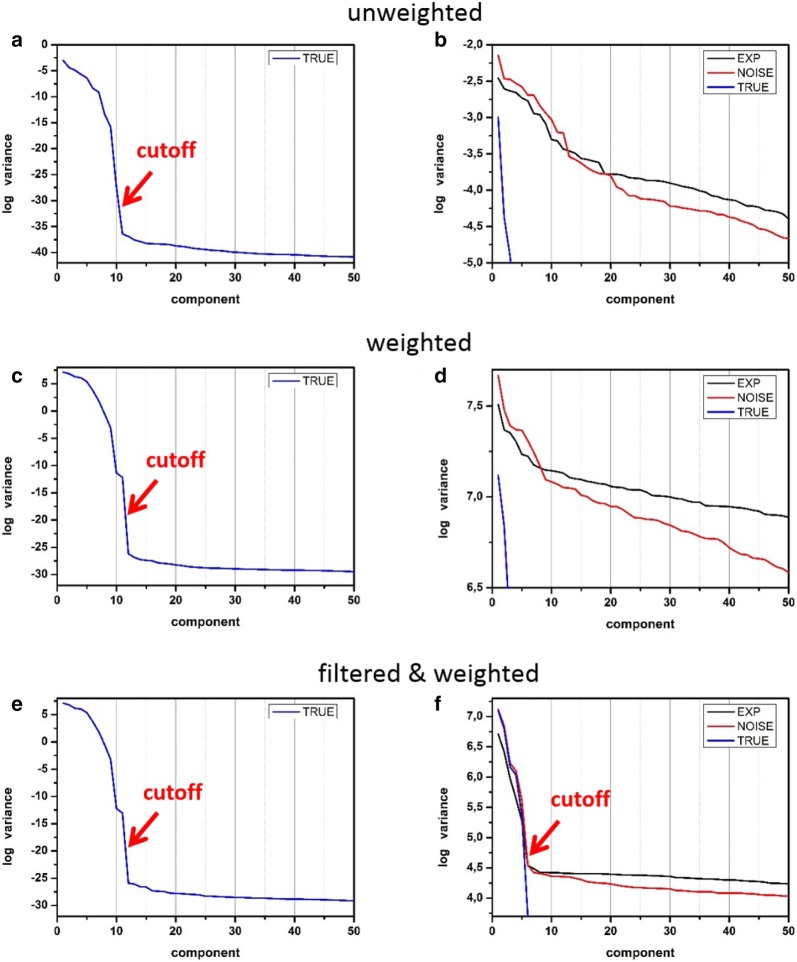
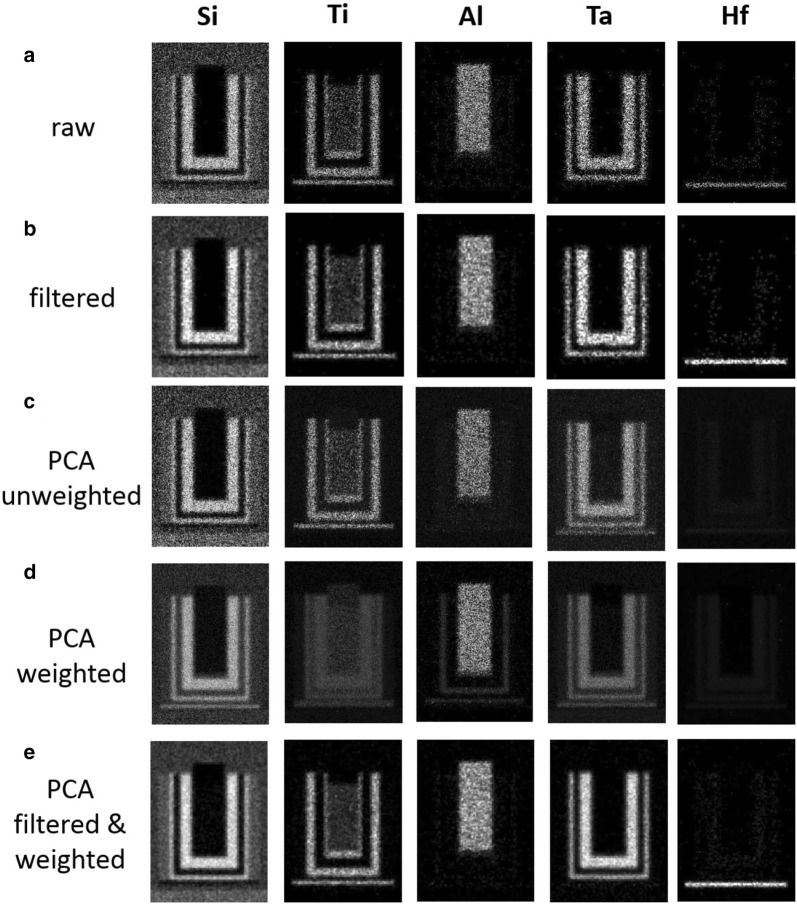
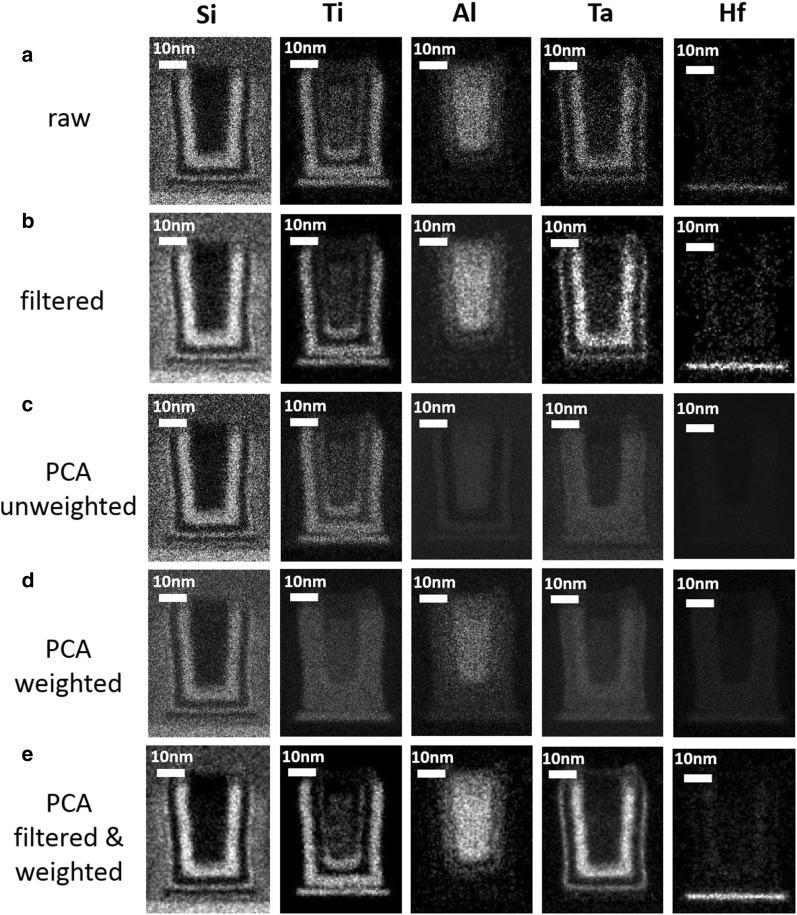
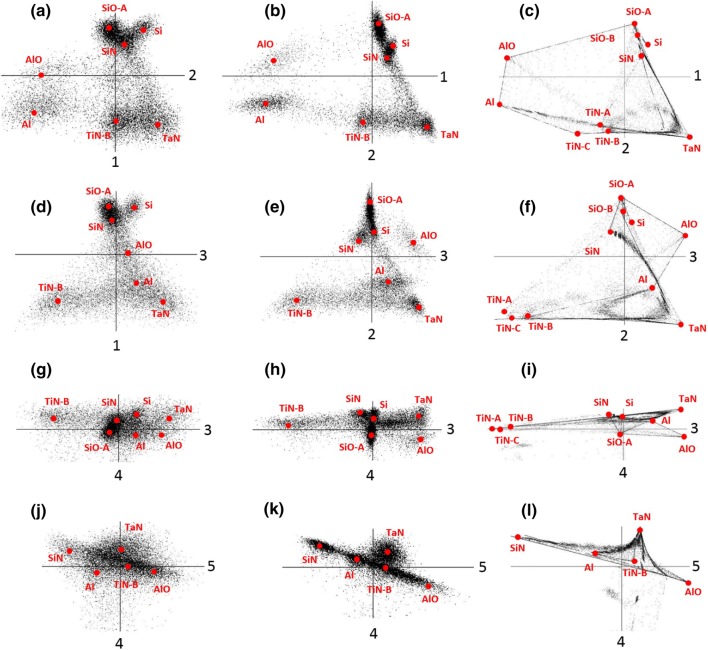
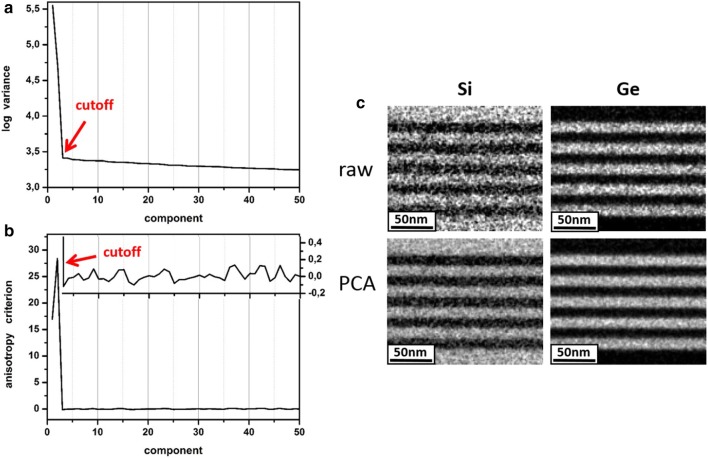
STEM XEDS spectrum images can be drastically denoised by application of the principal component analysis (PCA). This paper looks inside the PCA workflow step by step on an example of a complex semiconductor structure consisting of a number of different phases. Typical problems distorting the principal components decomposition are highlighted and solutions for the successful PCA are described. Particular attention is paid to the optimal truncation of principal components in the course of reconstructing denoised data. A novel accurate and robust method, which overperforms the existing truncation methods is suggested for the first time and described in details.

摘要

通过应用主成分分析(PCA),STEM XEDS光谱图像可以得到显著去噪。本文以一个由多个不同相组成的复杂半导体结构为例,逐步深入研究PCA工作流程。文中突出了扭曲主成分分解的典型问题,并描述了成功进行PCA的解决方案。在重建去噪数据的过程中,特别关注主成分的最优截断。首次提出并详细描述了一种新颖、准确且稳健的方法,该方法优于现有的截断方法。

https://cdn.ncbi.nlm.nih.gov/pmc/blobs/cfb1/6456488/d4af1d1e4927/40679_2019_66_Fig14_HTML.jpg
https://cdn.ncbi.nlm.nih.gov/pmc/blobs/cfb1/6456488/5e496ff9ba61/40679_2019_66_Fig1_HTML.jpg
https://cdn.ncbi.nlm.nih.gov/pmc/blobs/cfb1/6456488/5a69e9424db6/40679_2019_66_Fig2_HTML.jpg
https://cdn.ncbi.nlm.nih.gov/pmc/blobs/cfb1/6456488/5f2bcdfd2f19/40679_2019_66_Fig3_HTML.jpg
https://cdn.ncbi.nlm.nih.gov/pmc/blobs/cfb1/6456488/215d01d5bf83/40679_2019_66_Fig4_HTML.jpg
https://cdn.ncbi.nlm.nih.gov/pmc/blobs/cfb1/6456488/8307bb6f8502/40679_2019_66_Fig5_HTML.jpg
https://cdn.ncbi.nlm.nih.gov/pmc/blobs/cfb1/6456488/29956e131cfc/40679_2019_66_Fig6_HTML.jpg
https://cdn.ncbi.nlm.nih.gov/pmc/blobs/cfb1/6456488/890e706fdf3a/40679_2019_66_Fig7_HTML.jpg
https://cdn.ncbi.nlm.nih.gov/pmc/blobs/cfb1/6456488/c5c66e92e721/40679_2019_66_Fig8_HTML.jpg
https://cdn.ncbi.nlm.nih.gov/pmc/blobs/cfb1/6456488/756661f4fa5e/40679_2019_66_Fig9_HTML.jpg
https://cdn.ncbi.nlm.nih.gov/pmc/blobs/cfb1/6456488/3ec1ec6c2688/40679_2019_66_Fig10_HTML.jpg
https://cdn.ncbi.nlm.nih.gov/pmc/blobs/cfb1/6456488/60a65cf96f11/40679_2019_66_Fig11_HTML.jpg
https://cdn.ncbi.nlm.nih.gov/pmc/blobs/cfb1/6456488/0851e9c94b9f/40679_2019_66_Fig12_HTML.jpg
https://cdn.ncbi.nlm.nih.gov/pmc/blobs/cfb1/6456488/a5ee9502c754/40679_2019_66_Fig13_HTML.jpg
https://cdn.ncbi.nlm.nih.gov/pmc/blobs/cfb1/6456488/d4af1d1e4927/40679_2019_66_Fig14_HTML.jpg

相似文献

1
Optimal principal component analysis of STEM XEDS spectrum images.STEM能谱X射线能谱图像的最优主成分分析
Adv Struct Chem Imaging. 2019;5(1):4. doi: 10.1186/s40679-019-0066-0. Epub 2019 Apr 9.
2
Non-rigid registration and non-local principle component analysis to improve electron microscopy spectrum images.非刚性配准和非局部主成分分析改善电子显微镜谱图像。
Nanotechnology. 2016 Sep 9;27(36):364001. doi: 10.1088/0957-4484/27/36/364001. Epub 2016 Aug 1.
3
Adaptive denoising for chemical exchange saturation transfer MR imaging.化学交换饱和传递磁共振成像的自适应去噪。
NMR Biomed. 2019 Nov;32(11):e4133. doi: 10.1002/nbm.4133. Epub 2019 Jul 30.
4
Complex denoising of MR data via wavelet analysis: application for functional MRI.通过小波分析对磁共振数据进行复杂去噪:在功能磁共振成像中的应用
Magn Reson Imaging. 2000 Jan;18(1):59-68. doi: 10.1016/s0730-725x(99)00100-9.
5
Change Detection in SAR Images Based on the ROF Model Semi-Implicit Denoising Method.基于 ROF 模型半隐式去噪方法的 SAR 图像变化检测。
Sensors (Basel). 2019 Mar 7;19(5):1179. doi: 10.3390/s19051179.
6
Standardized processing of MALDI imaging raw data for enhancement of weak analyte signals in mouse models of gastric cancer and Alzheimer's disease.用于增强胃癌和阿尔茨海默病小鼠模型中弱分析物信号的基质辅助激光解吸/电离成像原始数据的标准化处理
Anal Bioanal Chem. 2015 Mar;407(8):2255-64. doi: 10.1007/s00216-014-8356-9. Epub 2014 Dec 27.
7
Improving Quantitative EDS Chemical Analysis of Alloy Nanoparticles by PCA Denoising: Part II. Uncertainty Intervals.通过主成分分析去噪改善合金纳米颗粒的定量能谱化学分析:第二部分。不确定区间。
Microsc Microanal. 2022 Apr 18:1-9. doi: 10.1017/S1431927622000551.
8
Extraction of physically meaningful endmembers from STEM spectrum-images combining geometrical and statistical approaches.结合几何和统计方法从STEM光谱图像中提取具有物理意义的端元。
Micron. 2021 Jun;145:103068. doi: 10.1016/j.micron.2021.103068. Epub 2021 Apr 8.
9
Adaptive Tensor-Based Principal Component Analysis for Low-Dose CT Image Denoising.基于自适应张量的主成分分析用于低剂量CT图像去噪
PLoS One. 2015 May 18;10(5):e0126914. doi: 10.1371/journal.pone.0126914. eCollection 2015.
10
Why Principal Component Analysis of STEM spectrum-images results in "abstract", uninterpretable loadings?为什么扫描透射电子显微镜能谱图像的主成分分析会产生“抽象的”、无法解释的载荷?
Ultramicroscopy. 2016 Jan;160:197-212. doi: 10.1016/j.ultramic.2015.10.020. Epub 2015 Oct 23.

引用本文的文献

1
Automated analysis of ultrastructure through large-scale hyperspectral electron microscopy.通过大规模高光谱电子显微镜对超微结构进行自动分析。
Npj Imaging. 2024 Dec 11;2(1):53. doi: 10.1038/s44303-024-00059-7.
2
Photothermal Laser Printing of Sub-Micrometer Crystalline ZnO Structures.亚微米级晶体氧化锌结构的光热激光打印
Adv Sci (Weinh). 2025 Jan;12(4):e2410771. doi: 10.1002/advs.202410771. Epub 2024 Dec 4.
3
Leveraging Machine Learning for Advanced Nanoscale X-ray Analysis: Unmixing Multicomponent Signals and Enhancing Chemical Quantification.

本文引用的文献

1
Managing dose-, damage- and data-rates in multi-frame spectrum-imaging.多帧光谱成像中的剂量、损伤和数据速率管理
Microscopy (Oxf). 2018 Mar 1;67(suppl_1):i98-i113. doi: 10.1093/jmicro/dfx125.
2
Patch-Based Principal Component Analysis for Face Recognition.基于补丁的主成分分析用于人脸识别。
Comput Intell Neurosci. 2017;2017:5317850. doi: 10.1155/2017/5317850. Epub 2017 Jul 11.
3
On the loss of information in PCA of spectrum-images.关于光谱图像主成分分析中的信息损失
利用机器学习进行先进的纳米级X射线分析:解混多组分信号并增强化学定量分析
Nano Lett. 2024 Aug 21;24(33):10177-10185. doi: 10.1021/acs.nanolett.4c02446. Epub 2024 Aug 6.
4
Enhancing spatial resolution in Fourier transform infrared spectral image via machine learning algorithms.通过机器学习算法提高傅里叶变换红外光谱图像的空间分辨率。
Sci Rep. 2023 Dec 20;13(1):22699. doi: 10.1038/s41598-023-50060-0.
5
Towards Automatic Detection of Precipitates in Inconel 625 Superalloy Additively Manufactured by the L-PBF Method.面向通过激光粉末床熔融(L-PBF)方法增材制造的Inconel 625高温合金中析出物的自动检测
Materials (Basel). 2021 Aug 11;14(16):4507. doi: 10.3390/ma14164507.
6
Nanoscale light element identification using machine learning aided STEM-EDS.使用机器学习辅助的扫描透射电子显微镜-能谱仪进行纳米级轻元素识别。
Sci Rep. 2020 Aug 13;10(1):13699. doi: 10.1038/s41598-020-70674-y.
Ultramicroscopy. 2017 Nov;182:191-194. doi: 10.1016/j.ultramic.2017.06.023. Epub 2017 Jul 6.
4
Enhancement of noisy EDX HRSTEM spectrum-images by combination of filtering and PCA.通过滤波与主成分分析相结合增强噪声电子能量损失谱高分辨扫描透射电子显微镜图像
Micron. 2017 May;96:29-37. doi: 10.1016/j.micron.2017.02.001. Epub 2017 Feb 10.
5
Principal component analysis: a review and recent developments.主成分分析:综述与最新进展
Philos Trans A Math Phys Eng Sci. 2016 Apr 13;374(2065):20150202. doi: 10.1098/rsta.2015.0202.
6
Why Principal Component Analysis of STEM spectrum-images results in "abstract", uninterpretable loadings?为什么扫描透射电子显微镜能谱图像的主成分分析会产生“抽象的”、无法解释的载荷?
Ultramicroscopy. 2016 Jan;160:197-212. doi: 10.1016/j.ultramic.2015.10.020. Epub 2015 Oct 23.
7
Performing elemental microanalysis with high accuracy and high precision by scanning electron microscopy/silicon drift detector energy-dispersive X-ray spectrometry (SEM/SDD-EDS).通过扫描电子显微镜/硅漂移探测器能量色散X射线光谱法(SEM/SDD-EDS)进行高精度和高准确度的元素微分析。
J Mater Sci. 2015;50(2):493-518. doi: 10.1007/s10853-014-8685-2. Epub 2014 Nov 12.
8
Representation learning: a review and new perspectives.表示学习:综述与新视角。
IEEE Trans Pattern Anal Mach Intell. 2013 Aug;35(8):1798-828. doi: 10.1109/TPAMI.2013.50.
9
Statistical consequences of applying a PCA noise filter on EELS spectrum images.应用 PCA 噪声滤波器对 EELS 谱图像的统计影响。
Ultramicroscopy. 2013 Feb;125:35-42. doi: 10.1016/j.ultramic.2012.10.001. Epub 2012 Oct 27.
10
Multivariate statistics applications in phase analysis of STEM-EDS spectrum images.多元统计分析在 STEM-EDS 能谱图像相分析中的应用。
Ultramicroscopy. 2010 Jan;110(2):134-43. doi: 10.1016/j.ultramic.2009.10.011. Epub 2009 Oct 24.