• 文献检索
  • 文档翻译
  • 深度研究
  • 学术资讯
  • Suppr Zotero 插件Zotero 插件
  • 邀请有礼
  • 套餐&价格
  • 历史记录
应用&插件
Suppr Zotero 插件Zotero 插件浏览器插件Mac 客户端Windows 客户端微信小程序
定价
高级版会员购买积分包购买API积分包
服务
文献检索文档翻译深度研究API 文档MCP 服务
关于我们
关于 Suppr公司介绍联系我们用户协议隐私条款
关注我们

Suppr 超能文献

核心技术专利:CN118964589B侵权必究
粤ICP备2023148730 号-1Suppr @ 2026

文献检索

告别复杂PubMed语法,用中文像聊天一样搜索,搜遍4000万医学文献。AI智能推荐,让科研检索更轻松。

立即免费搜索

文件翻译

保留排版,准确专业,支持PDF/Word/PPT等文件格式,支持 12+语言互译。

免费翻译文档

深度研究

AI帮你快速写综述,25分钟生成高质量综述,智能提取关键信息,辅助科研写作。

立即免费体验

RepViz:一种用于可视化基因组区域的复制驱动型R工具。

RepViz: a replicate-driven R tool for visualizing genomic regions.

作者信息

Faux Thomas, Rytkönen Kalle T, Laiho Asta, Elo Laura L

机构信息

Turku Bioscience Centre, University of Turku and Åbo Akademi University, Tykistökatu 6, 20520, Turku, Finland.

Institute of Biomedicine, Research Centre for Integrative Physiology and Pharmacology, University of Turku, Kiinamyllynkatu 10, 20014, Turku, Finland.

出版信息

BMC Res Notes. 2019 Jul 19;12(1):441. doi: 10.1186/s13104-019-4473-z.

DOI:10.1186/s13104-019-4473-z
PMID:31324268
原文链接:https://pmc.ncbi.nlm.nih.gov/articles/PMC6642542/
Abstract

OBJECTIVE

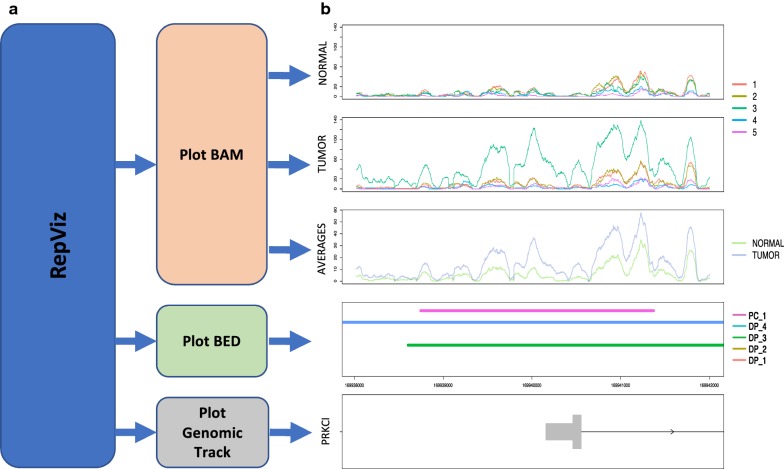
Visualization of sequencing data is an integral part of genomic data analysis. Although there are several tools to visualize sequencing data on genomic regions, they do not offer user-friendly ways to view simultaneously different groups of replicates. To address this need, we developed a tool that allows efficient viewing of both intra- and intergroup variation of sequencing counts on a genomic region, as well as their comparison to the output of user selected analysis methods, such as peak calling.

RESULTS

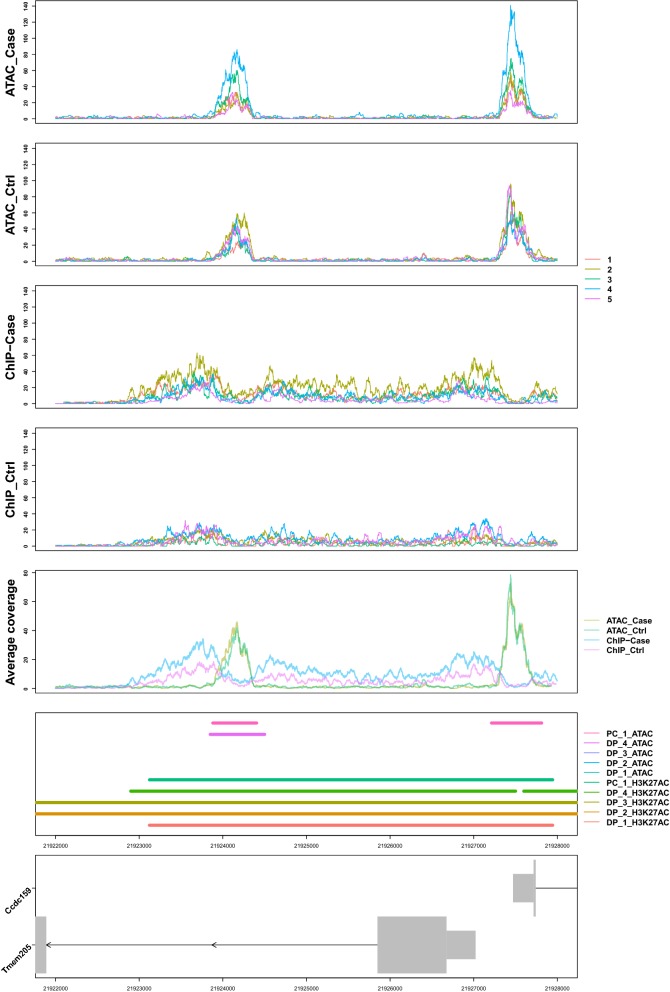
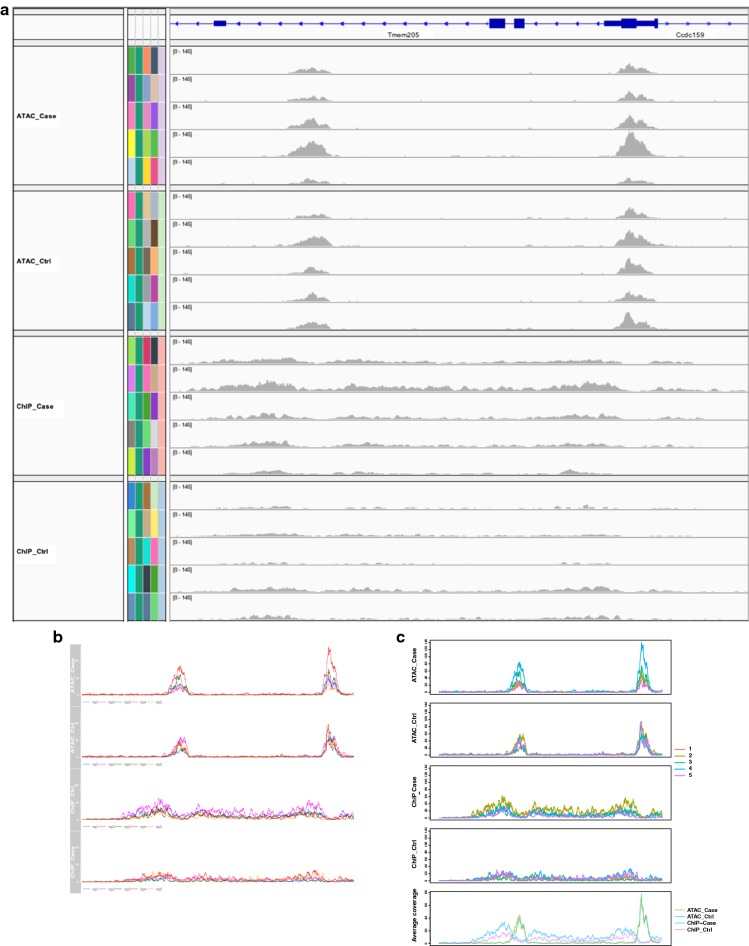
We present an R package RepViz for replicate-driven visualization of genomic regions. With ChIP-seq and ATAC-seq data we demonstrate its potential to aid visual inspection involved in the evaluation of normalization, outlier behavior, detected features from differential peak calling analysis, and combined analysis of multiple data types. RepViz is readily available on Bioconductor ( https://www.bioconductor.org/packages/devel/bioc/html/RepViz.html ) and on Github ( https://github.com/elolab/RepViz ).

摘要

目的

测序数据的可视化是基因组数据分析不可或缺的一部分。虽然有多种工具可用于在基因组区域可视化测序数据,但它们并未提供用户友好的方式来同时查看不同组的重复数据。为满足这一需求,我们开发了一种工具,该工具能够高效查看基因组区域上测序计数的组内和组间变异,以及将它们与用户选择的分析方法(如峰值检测)的输出结果进行比较。

结果

我们展示了一个用于基因组区域重复驱动可视化的R包RepViz。通过ChIP-seq和ATAC-seq数据,我们证明了它在辅助视觉检查方面的潜力,这些检查涉及归一化评估、异常值行为、差异峰值检测分析中检测到的特征以及多种数据类型的综合分析。RepViz可在Bioconductor(https://www.bioconductor.org/packages/devel/bioc/html/RepViz.html)和Github(https://github.com/elolab/RepViz)上获取。

https://cdn.ncbi.nlm.nih.gov/pmc/blobs/2335/6642542/f10c71f25993/13104_2019_4473_Fig3_HTML.jpg
https://cdn.ncbi.nlm.nih.gov/pmc/blobs/2335/6642542/436728572301/13104_2019_4473_Fig1_HTML.jpg
https://cdn.ncbi.nlm.nih.gov/pmc/blobs/2335/6642542/9b66483f9771/13104_2019_4473_Fig2_HTML.jpg
https://cdn.ncbi.nlm.nih.gov/pmc/blobs/2335/6642542/f10c71f25993/13104_2019_4473_Fig3_HTML.jpg
https://cdn.ncbi.nlm.nih.gov/pmc/blobs/2335/6642542/436728572301/13104_2019_4473_Fig1_HTML.jpg
https://cdn.ncbi.nlm.nih.gov/pmc/blobs/2335/6642542/9b66483f9771/13104_2019_4473_Fig2_HTML.jpg
https://cdn.ncbi.nlm.nih.gov/pmc/blobs/2335/6642542/f10c71f25993/13104_2019_4473_Fig3_HTML.jpg

相似文献

1
RepViz: a replicate-driven R tool for visualizing genomic regions.RepViz:一种用于可视化基因组区域的复制驱动型R工具。
BMC Res Notes. 2019 Jul 19;12(1):441. doi: 10.1186/s13104-019-4473-z.
2
ATACseqQC: a Bioconductor package for post-alignment quality assessment of ATAC-seq data.ATACseqQC:一个用于评估 ATAC-seq 数据的基于 Bioconductor 的序列后质量评估工具包。
BMC Genomics. 2018 Mar 1;19(1):169. doi: 10.1186/s12864-018-4559-3.
3
DNAshapeR: an R/Bioconductor package for DNA shape prediction and feature encoding.DNAshapeR:一个用于DNA形状预测和特征编码的R/Bioconductor软件包。
Bioinformatics. 2016 Apr 15;32(8):1211-3. doi: 10.1093/bioinformatics/btv735. Epub 2015 Dec 14.
4
esATAC: an easy-to-use systematic pipeline for ATAC-seq data analysis.esATAC:一个用于 ATAC-seq 数据分析的易用系统流程。
Bioinformatics. 2018 Aug 1;34(15):2664-2665. doi: 10.1093/bioinformatics/bty141.
5
Sushi.R: flexible, quantitative and integrative genomic visualizations for publication-quality multi-panel figures.Sushi.R:用于高质量多面板图表出版的灵活、定量和综合基因组可视化工具。
Bioinformatics. 2014 Oct;30(19):2808-10. doi: 10.1093/bioinformatics/btu379. Epub 2014 Jun 5.
6
TFEA.ChIP: a tool kit for transcription factor binding site enrichment analysis capitalizing on ChIP-seq datasets.TFEA.ChIP:一个转录因子结合位点富集分析工具包,利用 ChIP-seq 数据集。
Bioinformatics. 2019 Dec 15;35(24):5339-5340. doi: 10.1093/bioinformatics/btz573.
7
GenomicDistributions: fast analysis of genomic intervals with Bioconductor.基因组分布:使用 Bioconductor 快速分析基因组区间
BMC Genomics. 2022 Apr 12;23(1):299. doi: 10.1186/s12864-022-08467-y.
8
QuasR: quantification and annotation of short reads in R.QuasR:R语言中短读长的定量与注释
Bioinformatics. 2015 Apr 1;31(7):1130-2. doi: 10.1093/bioinformatics/btu781. Epub 2014 Nov 21.
9
GDCRNATools: an R/Bioconductor package for integrative analysis of lncRNA, miRNA and mRNA data in GDC.GDCRNATools:一个用于整合分析 GDC 中 lncRNA、miRNA 和 mRNA 数据的 R/Bioconductor 包。
Bioinformatics. 2018 Jul 15;34(14):2515-2517. doi: 10.1093/bioinformatics/bty124.
10
PAPST, a User Friendly and Powerful Java Platform for ChIP-Seq Peak Co-Localization Analysis and Beyond.PAPST,一个用于ChIP-Seq峰共定位分析及其他功能的用户友好且功能强大的Java平台。
PLoS One. 2015 May 13;10(5):e0127285. doi: 10.1371/journal.pone.0127285. eCollection 2015.

本文引用的文献

1
Enhancer RNA profiling predicts transcription factor activity.增强子 RNA 谱分析可预测转录因子活性。
Genome Res. 2018 Mar 1;28(3):334-344. doi: 10.1101/gr.225755.117.
2
Quantitative analysis of ChIP-seq data uncovers dynamic and sustained H3K4me3 and H3K27me3 modulation in cancer cells under hypoxia.ChIP-seq数据的定量分析揭示了缺氧条件下癌细胞中H3K4me3和H3K27me3的动态及持续调控。
Epigenetics Chromatin. 2016 Nov 1;9:48. doi: 10.1186/s13072-016-0090-4. eCollection 2016.
3
Differential peak calling of ChIP-seq signals with replicates with THOR.
使用THOR对具有重复样本的ChIP-seq信号进行差异峰检测。
Nucleic Acids Res. 2016 Nov 16;44(20):e153. doi: 10.1093/nar/gkw680. Epub 2016 Aug 2.
4
GenVisR: Genomic Visualizations in R.GenVisR:R语言中的基因组可视化
Bioinformatics. 2016 Oct 1;32(19):3012-4. doi: 10.1093/bioinformatics/btw325. Epub 2016 Jun 10.
5
Visualizing Genomic Data Using Gviz and Bioconductor.使用Gviz和Bioconductor可视化基因组数据。
Methods Mol Biol. 2016;1418:335-51. doi: 10.1007/978-1-4939-3578-9_16.
6
A comprehensive comparison of tools for differential ChIP-seq analysis.用于差异染色质免疫沉淀测序(ChIP-seq)分析的工具的全面比较。
Brief Bioinform. 2016 Nov;17(6):953-966. doi: 10.1093/bib/bbv110. Epub 2016 Jan 13.
7
rbamtools: an R interface to samtools enabling fast accumulative tabulation of splicing events over multiple RNA-seq samples.rbamtools:一个用于samtools的R接口,可实现对多个RNA测序样本的剪接事件进行快速累积制表。
Bioinformatics. 2015 May 15;31(10):1663-4. doi: 10.1093/bioinformatics/btu846. Epub 2015 Jan 5.
8
Genomation: a toolkit to summarize, annotate and visualize genomic intervals.Genomation:一个用于总结、注释和可视化基因组区间的工具包。
Bioinformatics. 2015 Apr 1;31(7):1127-9. doi: 10.1093/bioinformatics/btu775. Epub 2014 Nov 21.
9
Sushi.R: flexible, quantitative and integrative genomic visualizations for publication-quality multi-panel figures.Sushi.R:用于高质量多面板图表出版的灵活、定量和综合基因组可视化工具。
Bioinformatics. 2014 Oct;30(19):2808-10. doi: 10.1093/bioinformatics/btu379. Epub 2014 Jun 5.
10
PePr: a peak-calling prioritization pipeline to identify consistent or differential peaks from replicated ChIP-Seq data.PePr:一种峰值检测优先级排序流程,用于从重复的ChIP-Seq数据中识别一致或差异峰值。
Bioinformatics. 2014 Sep 15;30(18):2568-75. doi: 10.1093/bioinformatics/btu372. Epub 2014 Jun 3.