Division of Epidemiology, Department of Health Informatics and Public Health, Tohoku University School of Public Health, Graduate School of Medicine, 2-1 Seiryo-machi, Aoba-ku, Sendai, Miyagi, 980-8575, Japan.
Section of NILS-LSA, National Center for Geriatrics and Gerontology, 7-430 Morioka-cho, Obu City, Aichi, 474-8511, Japan.
Nutr J. 2019 Jul 30;18(1):43. doi: 10.1186/s12937-019-0468-9.
Although our previous study using a food frequency questionnaire simulated nutritional characteristics of the traditional Japanese diet, this issue has not been sufficiently evaluated. This study was conducted to examine the relationship between the traditional Japanese diet and nutrient density (ND).
A cross-sectional study employing the dietary record method was conducted among 2221 community-dwelling Japanese adults (40-88 years) living in Aichi Prefecture, Japan, in 2006-2008. Based on previous studies, a 9-component Japanese Diet Index (JDI) and a 12-component modified JDI (mJDI) were defined. To develop a new weighted index, a multiple linear regression model was used to select food components which were significantly associated with an ND score (integrated by 11 nutrient components) from the mJDI and weight them. Correlation analyses were performed between JDI, mJDI, the new weighted JDI score and the ND score and its 11 nutrient components. The findings were validated with data from 2008 to 2010 by assessing the associations between the JDIs scores and the ND score.
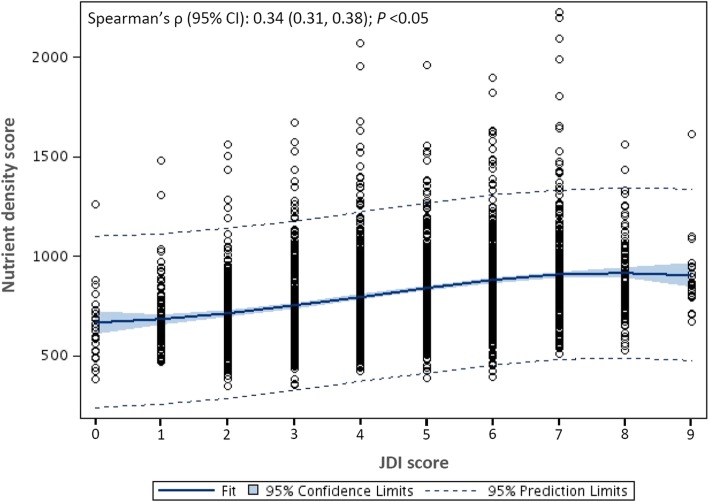
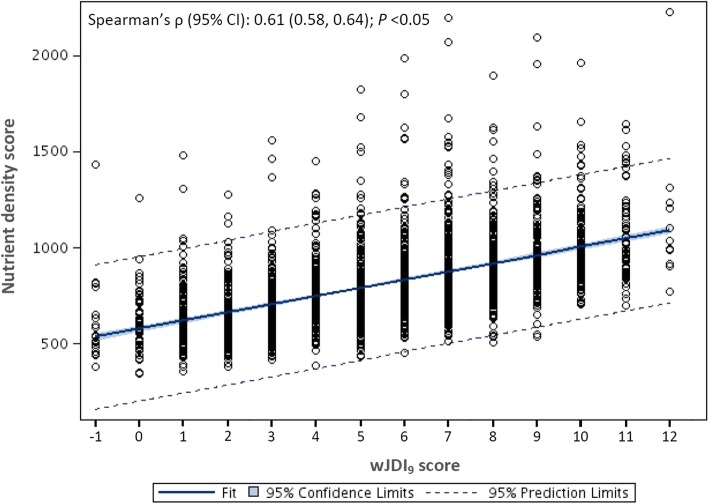
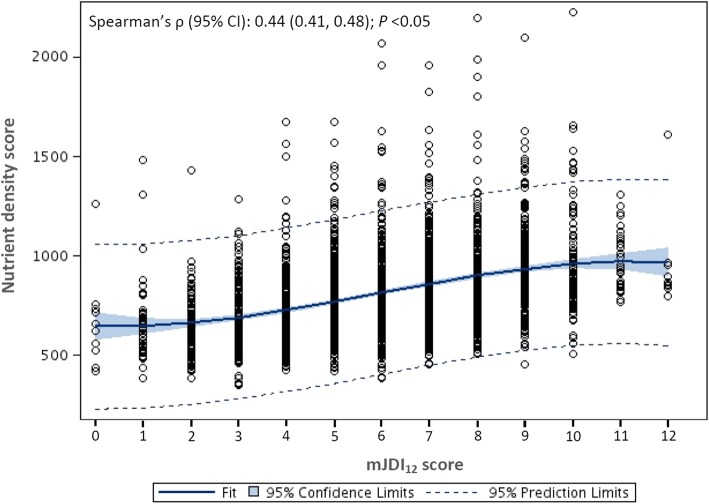
Scores of the JDI and mJDI were positively correlated with the ND score (corresponding Spearman's ρ [95% confidence interval; CI], 0.34 [0.31, 0.38] and 0.44 [0.41, 0.48], respectively; P < 0.05 for both). Among the mJDI, 9 food components (rice, fish and shellfish, green and yellow vegetables, seaweed, green tea, beef and pork, soybeans and soybean foods, fruit, and mushrooms) significantly associated with the ND score. All of these 9 components were weighted and a new weighted JDI (wJDI) was developed. The wJDI score was also positively correlated with the ND score (Spearman's ρ [95% CI] = 0.61 [0.58, 0.64]; P < 0.05). However, scores for all 3 indices were positively correlated with sodium intake. The wJDI score obtained using dietary record data from 2008 to 2010 was also positively correlated with the ND score (Spearman's ρ [95% CI] = 0.61 [0.58, 0.64]; P < 0.05).
CONCLUSIONS-: Adhering to a traditional Japanese diet as defined by the JDI was associated with good ND. Furthermore, the modified indices (mJDI and wJDI) had a higher performance for ND. However, all of the indices were correlated with high sodium intake.
尽管我们之前使用食物频率问卷模拟了传统日本饮食的营养特征,但这一问题尚未得到充分评估。本研究旨在检验传统日本饮食与营养素密度(ND)之间的关系。
2006 年至 2008 年,在日本爱知县的 2221 名社区居住的日本成年人(40-88 岁)中进行了一项基于饮食记录法的横断面研究。基于先前的研究,定义了 9 个成分的日本饮食指数(JDI)和 12 个成分的改良 JDI(mJDI)。为了开发新的加权指数,使用多元线性回归模型从 mJDI 中选择与 ND 评分(由 11 种营养成分组成)显著相关的食物成分,并对其进行加权。对 JDI、mJDI、新加权 JDI 评分与 ND 评分及其 11 种营养成分进行相关性分析。使用 2008 年至 2010 年的数据验证 JDI 评分与 ND 评分之间的关联。
JDI 和 mJDI 的评分与 ND 评分呈正相关(相应的斯皮尔曼 ρ[95%置信区间;CI],0.34[0.31, 0.38]和 0.44[0.41, 0.48];均 P<0.05)。在 mJDI 中,有 9 种食物成分(米饭、鱼贝类、绿色和黄色蔬菜、海藻、绿茶、牛肉和猪肉、大豆和豆制品、水果和蘑菇)与 ND 评分显著相关。所有这 9 种成分均进行了加权,并开发了一种新的加权 JDI(wJDI)。wJDI 评分也与 ND 评分呈正相关(斯皮尔曼 ρ[95%CI],0.61[0.58, 0.64];P<0.05)。然而,所有 3 个指数的评分均与钠摄入量呈正相关。2008 年至 2010 年使用饮食记录数据获得的 wJDI 评分也与 ND 评分呈正相关(斯皮尔曼 ρ[95%CI],0.61[0.58, 0.64];P<0.05)。
JDI 定义的传统日本饮食模式与良好的 ND 相关。此外,改良指数(mJDI 和 wJDI)在 ND 方面具有更高的性能。然而,所有指数都与高钠摄入量相关。