Cesare Nina, Nguyen Quynh C, Grant Christan, Nsoesie Elaine O
Department of Global Health, Boston University School of Public Health, Boston, Massachusetts, USA.
Institute for Health Metrics and Evaluation, University of Washington, Seattle, Washington, USA.
BMJ Open Sport Exerc Med. 2019 Jul 14;5(1):e000567. doi: 10.1136/bmjsem-2019-000567. eCollection 2019.
We examined the use of data from social media for surveillance of physical activity prevalence in the USA.
We obtained data from the social media site Twitter from April 2015 to March 2016. The data consisted of 1 382 284 geotagged physical activity tweets from 481 146 users (55.7% men and 44.3% women) in more than 2900 counties. We applied machine learning and statistical modelling to demonstrate sex and regional variations in preferred exercises, and assessed the association between reports of physical activity on Twitter and population-level inactivity prevalence from the US Centers for Disease Control and Prevention.
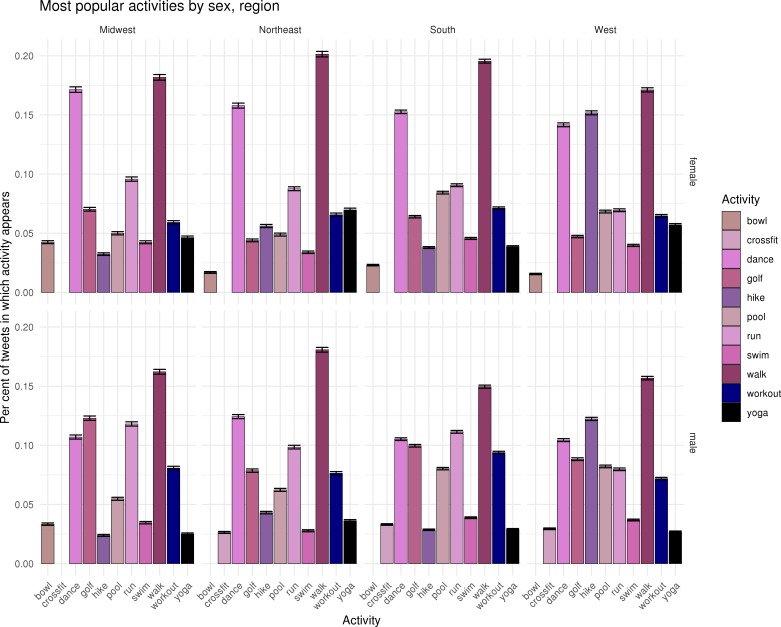
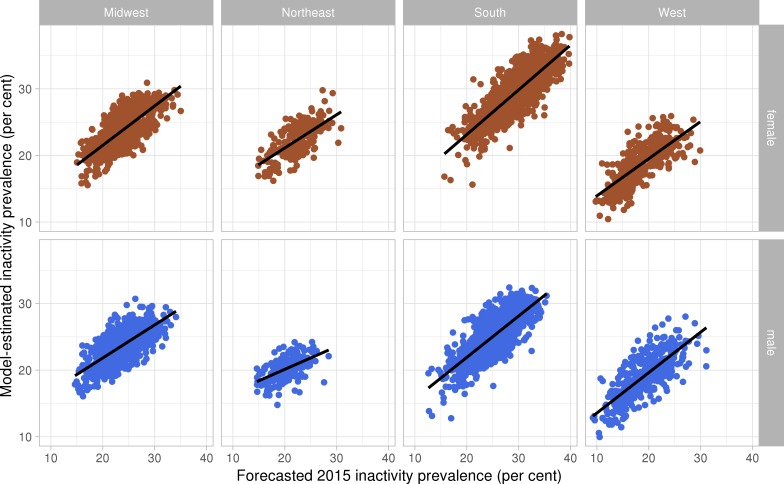
The association between physical inactivity tweet patterns and physical activity prevalence varied by sex and region. Walking was the most popular physical activity for both men and women across all regions (15.94% (95% CI 15.85% to 16.02%) and 18.74% (95% CI 18.64% to 18.88%) of tweets, respectively). Men and women mentioned performing gym-based activities at approximately the same rates (4.68% (95% CI 4.63% to 4.72%) and 4.13% (95% CI 4.08% to 4.18%) of tweets, respectively). CrossFit was most popular among men (14.91% (95% CI 14.52% to 15.31%)) among gym-based tweets, whereas yoga was most popular among women (26.66% (95% CI 26.03% to 27.19%)). Men mentioned engaging in higher intensity activities than women. Overall, counties with higher physical activity tweets also had lower leisure-time physical inactivity prevalence for both sexes.
The regional-specific and sex-specific activity patterns captured on Twitter may allow public health officials to identify changes in health behaviours at small geographical scales and to design interventions best suited for specific populations.
我们研究了利用社交媒体数据监测美国身体活动流行情况。
我们获取了2015年4月至2016年3月期间社交媒体网站推特的数据。这些数据包括来自2900多个县的481146名用户(55.7%为男性,44.3%为女性)的1382284条带有地理标记的身体活动推文。我们应用机器学习和统计建模来展示不同性别和地区在偏好运动方面的差异,并评估推特上身体活动报告与美国疾病控制与预防中心公布的人群层面不活动流行率之间的关联。
不活动推文模式与身体活动流行率之间的关联因性别和地区而异。在所有地区,步行是男性和女性最受欢迎的身体活动(推文分别占15.94%(95%可信区间15.85%至16.02%)和18.74%(95%可信区间18.64%至18.88%))。男性和女性提及进行健身房活动的比例大致相同(推文分别占4.68%(95%可信区间4.63%至4.72%)和4.13%(95%可信区间4.08%至4.18%))。在基于健身房的推文中,CrossFit在男性中最受欢迎(14.91%(95%可信区间14.52%至15.31%)),而瑜伽在女性中最受欢迎(26.66%(95%可信区间26.03%至27.19%))。男性提及参与的活动强度高于女性。总体而言,身体活动推文较多的县,男女休闲时间身体不活动的流行率也较低。
推特上捕捉到的特定地区和特定性别的活动模式可能使公共卫生官员能够在小地理尺度上识别健康行为的变化,并设计最适合特定人群的干预措施。