Departamento de Nutrição, Universidade de Sao Paulo, Sao Paulo, Brazil
Núcleo de Pesquisas Epidemiológicas em Nutrição e Saúde, Universidade de Sao Paulo, Sao Paulo, Brazil.
BMJ Open. 2019 Oct 28;9(10):e027546. doi: 10.1136/bmjopen-2018-027546.
To describe dietary sources of free sugars in different age groups of the UK population considering food groups classified according to the NOVA system and to estimate the proportion of excessive free sugars that could potentially be avoided by reducing consumption of their main sources.
Cross-sectional data from the UK National Diet and Nutrition Survey (2008-2014) were analysed. Food items collected using a 4-day food diary were classified according to the NOVA system.
9364 individuals aged 1.5 years and above.
Average dietary content of free sugars and proportion of individuals consuming more than 10% of total energy from free sugars.
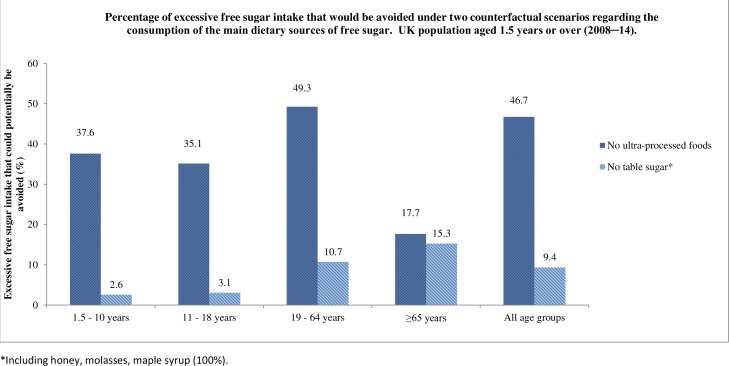
Poisson regression was used to estimate the associations between each of the NOVA food group and intake of free sugars. We estimated the per cent reduction in prevalence of excessive free sugar intake from eliminating ultra-processed foods and table sugar. Analyses were stratified by age group and adjusted for age, sex, ethnicity, survey year, region and equivalised household income (sterling pounds).
Ultra-processed foods account for 56.8% of total energy intake and 64.7% of total free sugars in the UK diet. Free sugars represent 12.4% of total energy intake, and 61.3% of the sample exceeded the recommended limit of 10% energy from free sugars. This percentage was higher among children (74.9%) and adolescents (82.9%). Prevalence of excessive free sugar intake increased linearly across quintiles of ultra-processed food consumption for all age groups, except among the elderly. Eliminating ultra-processed foods could potentially reduce the prevalence of excessive free sugar intake by 47%.
Our findings suggest that actions to reduce the ultra-processed food consumption generally rich in free sugars could lead to substantial public health benefits.
描述英国不同年龄组人群饮食中游离糖的来源,考虑到按照 NOVA 系统分类的食物组,并估计通过减少其主要来源的消费,潜在可以避免的过量游离糖的比例。
分析了来自英国国家饮食与营养调查(2008-2014 年)的横断面数据。使用 4 天食物日记收集的食物项目按照 NOVA 系统进行分类。
年龄在 1.5 岁及以上的 9364 人。
游离糖的平均饮食含量和消耗超过总能量 10%游离糖的个体比例。
使用泊松回归估计每个 NOVA 食物组与游离糖摄入之间的关联。我们估计了从消除超加工食品和食糖中减少过量游离糖摄入的百分比。分析按年龄组分层,并根据年龄、性别、种族、调查年份、地区和家庭收入(英镑)进行了调整。
超加工食品占英国饮食总能量的 56.8%,总游离糖的 64.7%。游离糖占总能量的 12.4%,61.3%的样本超过了推荐的游离糖 10%能量限制。这一比例在儿童(74.9%)和青少年(82.9%)中更高。除了老年人外,所有年龄组的超加工食品消费五分位数越高,过量游离糖摄入的比例呈线性增加。消除超加工食品可能会使过量游离糖摄入的流行率降低 47%。
我们的研究结果表明,减少富含游离糖的超加工食品的消费一般可以带来重大的公共卫生效益。