• 文献检索
  • 文档翻译
  • 深度研究
  • 学术资讯
  • Suppr Zotero 插件Zotero 插件
  • 邀请有礼
  • 套餐&价格
  • 历史记录
应用&插件
Suppr Zotero 插件Zotero 插件浏览器插件Mac 客户端Windows 客户端微信小程序
定价
高级版会员购买积分包购买API积分包
服务
文献检索文档翻译深度研究API 文档MCP 服务
关于我们
关于 Suppr公司介绍联系我们用户协议隐私条款
关注我们

Suppr 超能文献

核心技术专利:CN118964589B侵权必究
粤ICP备2023148730 号-1Suppr @ 2026

文献检索

告别复杂PubMed语法,用中文像聊天一样搜索,搜遍4000万医学文献。AI智能推荐,让科研检索更轻松。

立即免费搜索

文件翻译

保留排版,准确专业,支持PDF/Word/PPT等文件格式,支持 12+语言互译。

免费翻译文档

深度研究

AI帮你快速写综述,25分钟生成高质量综述,智能提取关键信息,辅助科研写作。

立即免费体验

基于 GIS 的美国大陆 COVID-19 发病率空间建模。

GIS-based spatial modeling of COVID-19 incidence rate in the continental United States.

机构信息

Department of Public Health and Prevention Sciences, School of Health Sciences, Baldwin Wallace University, Berea, OH, USA.

Department of Geography, University of California Santa Barbara (UCSB), Santa Barbara, CA, USA.

出版信息

Sci Total Environ. 2020 Aug 1;728:138884. doi: 10.1016/j.scitotenv.2020.138884. Epub 2020 Apr 22.

DOI:10.1016/j.scitotenv.2020.138884
PMID:32335404
原文链接:https://pmc.ncbi.nlm.nih.gov/articles/PMC7175907/
Abstract

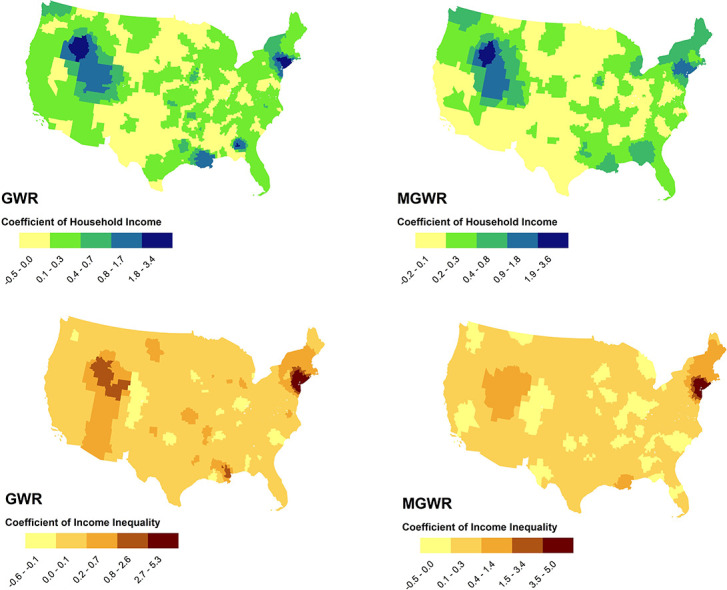
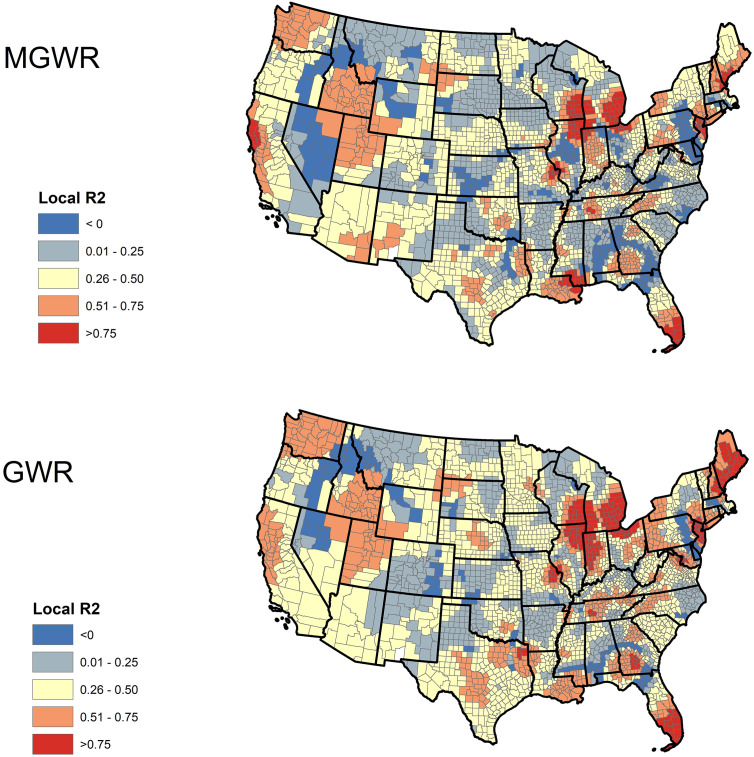
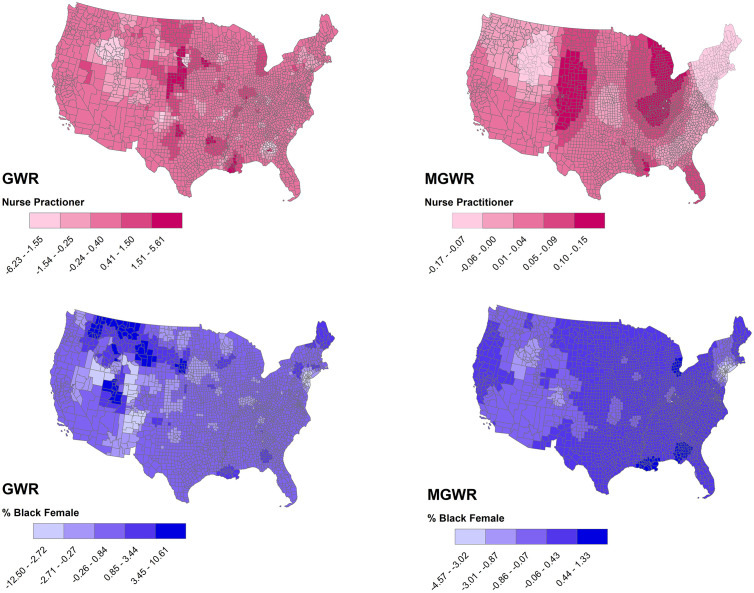
During the first 90 days of the COVID-19 outbreak in the United States, over 675,000 confirmed cases of the disease have been reported, posing unprecedented socioeconomic burden to the country. Due to inadequate research on geographic modeling of COVID-19, we investigated county-level variations of disease incidence across the continental United States. We compiled a geodatabase of 35 environmental, socioeconomic, topographic, and demographic variables that could explain the spatial variability of disease incidence. Further, we employed spatial lag and spatial error models to investigate spatial dependence and geographically weighted regression (GWR) and multiscale GWR (MGWR) models to locally examine spatial non-stationarity. The results suggested that even though incorporating spatial autocorrelation could significantly improve the performance of the global ordinary least square model, these models still represent a significantly poor performance compared to the local models. Moreover, MGWR could explain the highest variations (adj. R: 68.1%) with the lowest AICc compared to the others. Mapping the effects of significant explanatory variables (i.e., income inequality, median household income, the proportion of black females, and the proportion of nurse practitioners) on spatial variability of COVID-19 incidence rates using MGWR could provide useful insights to policymakers for targeted interventions.

摘要

在美国 COVID-19 疫情爆发的头 90 天里,已报告超过 67.5 万例确诊病例,给该国带来了前所未有的社会经济负担。由于对 COVID-19 地理建模的研究不足,我们调查了美国大陆各县的疾病发病率差异。我们编制了一个包含 35 个环境、社会经济、地形和人口变量的地理数据库,这些变量可以解释疾病发病率的空间变化。此外,我们还采用了空间滞后和空间误差模型来研究空间依赖性,以及地理加权回归 (GWR) 和多尺度 GWR (MGWR) 模型来局部检查空间非平稳性。结果表明,尽管纳入空间自相关可以显著提高全局普通最小二乘模型的性能,但与局部模型相比,这些模型的表现仍然很差。此外,MGWR 可以用最低的 AICc 解释最高的变化(adj. R:68.1%)。使用 MGWR 对收入不平等、家庭中位数收入、黑人女性比例和执业护士比例等显著解释变量对 COVID-19 发病率空间变化的影响进行映射,可以为政策制定者提供有针对性的干预措施提供有用的见解。

https://cdn.ncbi.nlm.nih.gov/pmc/blobs/81c5/7175907/ea2e04273633/gr3_lrg.jpg
https://cdn.ncbi.nlm.nih.gov/pmc/blobs/81c5/7175907/698dc56e8459/ga1_lrg.jpg
https://cdn.ncbi.nlm.nih.gov/pmc/blobs/81c5/7175907/a6676738b9a9/gr1_lrg.jpg
https://cdn.ncbi.nlm.nih.gov/pmc/blobs/81c5/7175907/78335d5ef0fb/gr2_lrg.jpg
https://cdn.ncbi.nlm.nih.gov/pmc/blobs/81c5/7175907/ea2e04273633/gr3_lrg.jpg

相似文献

1
GIS-based spatial modeling of COVID-19 incidence rate in the continental United States.基于 GIS 的美国大陆 COVID-19 发病率空间建模。
Sci Total Environ. 2020 Aug 1;728:138884. doi: 10.1016/j.scitotenv.2020.138884. Epub 2020 Apr 22.
2
Artificial Neural Network Modeling of Novel Coronavirus (COVID-19) Incidence Rates across the Continental United States.人工神经网络模型对美国大陆新型冠状病毒(COVID-19)发病率的预测。
Int J Environ Res Public Health. 2020 Jun 12;17(12):4204. doi: 10.3390/ijerph17124204.
3
A multimethod approach for county-scale geospatial analysis of emerging infectious diseases: a cross-sectional case study of COVID-19 incidence in Germany.一种用于县级新兴传染病地理空间分析的多方法研究:德国 COVID-19 发病率的横断面案例研究。
Int J Health Geogr. 2020 Aug 13;19(1):32. doi: 10.1186/s12942-020-00225-1.
4
GIS-based spatio-temporal analysis and modeling of COVID-19 incidence rates in Europe.基于 GIS 的欧洲 COVID-19 发病率时空分析与建模。
Spat Spatiotemporal Epidemiol. 2022 Jun;41:100498. doi: 10.1016/j.sste.2022.100498. Epub 2022 Mar 4.
5
Spatial Disparities in Coronavirus Incidence and Mortality in the United States: An Ecological Analysis as of May 2020.美国冠状病毒发病率和死亡率的空间差异:截至 2020 年 5 月的生态分析。
J Rural Health. 2020 Jun;36(3):433-445. doi: 10.1111/jrh.12476. Epub 2020 Jun 16.
6
How Did Distribution Patterns of Particulate Matter Air Pollution (PM and PM) Change in China during the COVID-19 Outbreak: A Spatiotemporal Investigation at Chinese City-Level.中国 COVID-19 疫情期间大气颗粒物污染(PM 和 PM)的时空分布模式如何变化:基于中国城市级的时空调查。
Int J Environ Res Public Health. 2020 Aug 28;17(17):6274. doi: 10.3390/ijerph17176274.
7
Exploring spatiotemporal effects of the driving factors on COVID-19 incidences in the contiguous United States.探究驱动因素对美国本土COVID-19发病率的时空影响。
Sustain Cities Soc. 2021 May;68:102784. doi: 10.1016/j.scs.2021.102784. Epub 2021 Feb 19.
8
A spatial analysis of the COVID-19 period prevalence in U.S. counties through June 28, 2020: where geography matters?美国各县 2020 年 6 月 28 日前 COVID-19 期间流行情况的空间分析:地理因素重要吗?
Ann Epidemiol. 2020 Dec;52:54-59.e1. doi: 10.1016/j.annepidem.2020.07.014. Epub 2020 Jul 28.
9
Spatial analysis of COVID-19 incidence and its determinants using spatial modeling: A study on India.使用空间建模对COVID-19发病率及其决定因素进行空间分析:印度的一项研究。
Environ Chall (Amst). 2021 Aug;4:100096. doi: 10.1016/j.envc.2021.100096. Epub 2021 Apr 10.
10
Changes in the spatial distribution of COVID-19 incidence in Italy using GIS-based maps.利用基于地理信息系统的地图分析意大利新冠肺炎发病率的空间分布变化。
Ann Clin Microbiol Antimicrob. 2020 Jul 18;19(1):30. doi: 10.1186/s12941-020-00373-z.

引用本文的文献

1
A framework for modeling county-level COVID-19 transmission.一个用于模拟县级新冠病毒传播的框架。
Front Public Health. 2025 Aug 5;13:1608360. doi: 10.3389/fpubh.2025.1608360. eCollection 2025.
2
Spatiotemporal dynamics and associated drivers of COVID-19 incidence in Nepal.尼泊尔新冠肺炎发病率的时空动态及相关驱动因素
Trop Med Health. 2025 Aug 19;53(1):111. doi: 10.1186/s41182-025-00741-5.
3
Geospatial assessment of household water, sanitation and hygiene conditions and associated factors in Nigeria: A causal relationship model.

本文引用的文献

1
The Johns Hopkins University Center for Systems Science and Engineering COVID-19 Dashboard: data collection process, challenges faced, and lessons learned.约翰斯·霍普金斯大学系统科学与工程中心 COVID-19 数据仪表盘:数据收集流程、面临的挑战和经验教训。
Lancet Infect Dis. 2022 Dec;22(12):e370-e376. doi: 10.1016/S1473-3099(22)00434-0. Epub 2022 Aug 31.
2
Air pollution and COVID-19 mortality in the United States: Strengths and limitations of an ecological regression analysis.空气污染与美国新冠肺炎死亡率:生态回归分析的优势与局限
Sci Adv. 2020 Nov 4;6(45). doi: 10.1126/sciadv.abd4049. Print 2020 Nov.
3
Effects of temperature variation and humidity on the death of COVID-19 in Wuhan, China.
尼日利亚家庭水、环境卫生和个人卫生条件及相关因素的地理空间评估:一种因果关系模型
PLoS One. 2025 Aug 14;20(8):e0330167. doi: 10.1371/journal.pone.0330167. eCollection 2025.
4
Detecting outbreaks using a spatial latent field.使用空间潜在场检测疫情爆发。
PLoS One. 2025 Jul 31;20(7):e0328770. doi: 10.1371/journal.pone.0328770. eCollection 2025.
5
Differential health outcomes of the COVID-19 pandemic among minority populations: An analysis based on Chicago's neighborhoods.新冠疫情在少数族裔人群中的差异化健康结果:基于芝加哥社区的分析
Public Health Chall. 2023 Jul 21;2(3):e111. doi: 10.1002/puh2.111. eCollection 2023 Sep.
6
Examining spatial variations in the relationship between domestic energy consumption and its driving factors using multiscale geographically weighted regression: a case study in Nottingham, England.使用多尺度地理加权回归研究家庭能源消耗与其驱动因素之间关系的空间变化:以英国诺丁汉为例
Energy Sustain Soc. 2025;15(1):24. doi: 10.1186/s13705-025-00523-1. Epub 2025 May 11.
7
Spatial Analysis of Tuberculosis, COVID-19, and Tuberculosis/COVID-19 Coinfection in Recife, PE, Brazil.巴西伯南布哥州累西腓市结核病、新冠肺炎及结核病/新冠肺炎合并感染的空间分析
Int J Environ Res Public Health. 2025 Apr 2;22(4):545. doi: 10.3390/ijerph22040545.
8
Alzheimer's Disease Dementia Prevalence in the United States: A County-Level Spatial Machine Learning Analysis.美国阿尔茨海默病性痴呆症的患病率:县级空间机器学习分析
Am J Alzheimers Dis Other Demen. 2025 Jan-Dec;40:15333175251335570. doi: 10.1177/15333175251335570. Epub 2025 Apr 21.
9
Dynamics of urban green spaces in a megacity under the green economy framework and their influencing factors: a case study of Chongqing urban area.绿色经济框架下特大城市城市绿地动态及其影响因素:以重庆市区为例
Front Public Health. 2025 Jan 15;12:1517554. doi: 10.3389/fpubh.2024.1517554. eCollection 2024.
10
Identification of emerging harms due to COVID-19 outbreak: a qualitative study in Iran.识别新冠疫情引发的新出现危害:伊朗的一项定性研究。
BMC Public Health. 2025 Jan 29;25(1):361. doi: 10.1186/s12889-025-21513-0.
温度变化和湿度对中国武汉 COVID-19 死亡的影响。
Sci Total Environ. 2020 Jul 1;724:138226. doi: 10.1016/j.scitotenv.2020.138226. Epub 2020 Mar 26.
4
The powerful immune system against powerful COVID-19: A hypothesis.强大的免疫系统对抗强大的 COVID-19:一个假设。
Med Hypotheses. 2020 Jul;140:109762. doi: 10.1016/j.mehy.2020.109762. Epub 2020 Apr 22.
5
Demographic science aids in understanding the spread and fatality rates of COVID-19.人口科学有助于了解 COVID-19 的传播和死亡率。
Proc Natl Acad Sci U S A. 2020 May 5;117(18):9696-9698. doi: 10.1073/pnas.2004911117. Epub 2020 Apr 16.
6
Which Melbourne Metropolitan Areas Are Vulnerable to COVID-19 Based on Age, Disability, and Access to Health Services? Using Spatial Analysis to Identify Service Gaps and Inform Delivery.基于年龄、残疾和获得卫生服务的情况,哪些墨尔本都会区容易受到 COVID-19 的影响?利用空间分析来发现服务差距并为服务提供提供信息。
J Pain Symptom Manage. 2020 Jul;60(1):e41-e44. doi: 10.1016/j.jpainsymman.2020.03.041. Epub 2020 Apr 8.
7
Novel Coronavirus in Cape Town Informal Settlements: Feasibility of Using Informal Dwelling Outlines to Identify High Risk Areas for COVID-19 Transmission From A Social Distancing Perspective.新型冠状病毒在开普敦非正式住区的传播:从社交隔离的角度来看,利用非正式住区轮廓来确定高风险新冠病毒传播区域的可行性。
JMIR Public Health Surveill. 2020 Apr 6;6(2):e18844. doi: 10.2196/18844.
8
Targeting the spatial context of obesity determinants via multiscale geographically weighted regression.通过多尺度地理加权回归来针对肥胖决定因素的空间背景。
Int J Health Geogr. 2020 Apr 5;19(1):11. doi: 10.1186/s12942-020-00204-6.
9
Why inequality could spread COVID-19.为何不平等会传播新冠病毒。
Lancet Public Health. 2020 May;5(5):e240. doi: 10.1016/S2468-2667(20)30085-2. Epub 2020 Apr 2.
10
Smoking Upregulates Angiotensin-Converting Enzyme-2 Receptor: A Potential Adhesion Site for Novel Coronavirus SARS-CoV-2 (Covid-19).吸烟上调血管紧张素转换酶2受体:新型冠状病毒SARS-CoV-2(新冠病毒)的潜在粘附位点。
J Clin Med. 2020 Mar 20;9(3):841. doi: 10.3390/jcm9030841.