Department of Gastroenterology, the First Affiliated Hospital of Nanchang University, 17 Yongwaizheng Street, Nanchang, 330006, Jiangxi, China.
BMC Cancer. 2020 Jun 29;20(1):608. doi: 10.1186/s12885-020-07099-3.
Considering that the knowledge of adenocarcinoma in villous adenoma of the colorectum is limited to several case reports, we designed a study to investigate independent prognostic factors and developed nomograms for predicting the survival of patients.
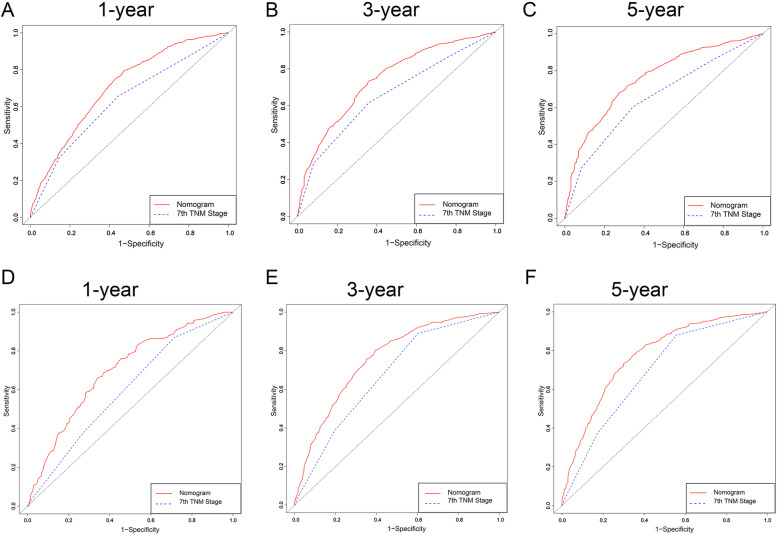
Univariate and multivariate Cox regression analyses were used to evaluate prognostic factors. A nomogram predicting cancer-specific survival (CSS) was performed; internally and externally validated; evaluated by receiver operating characteristic (ROC) curve, C-index, and decision curve analyses; and compared to the 7th TNM stage.
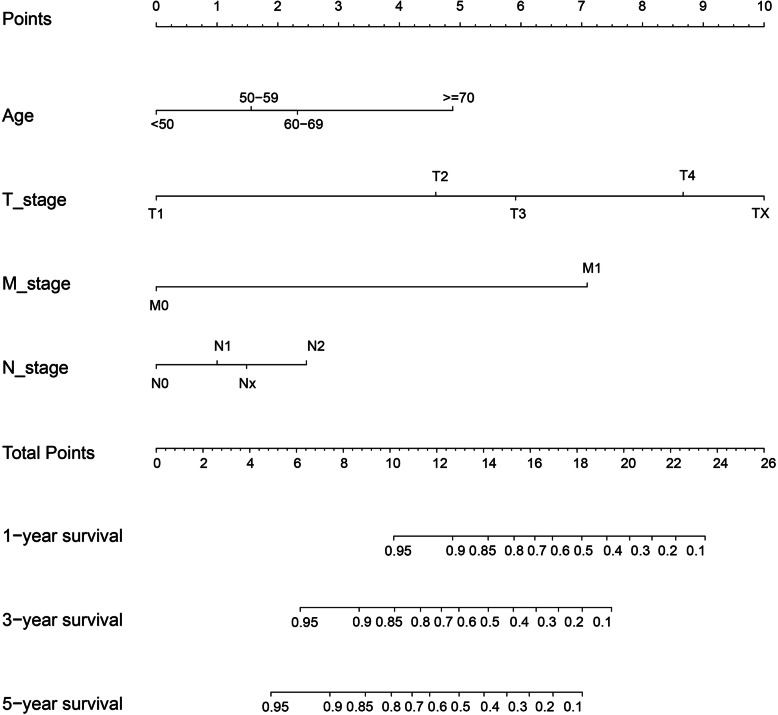
Patients with adenocarcinoma in villous adenoma of the colorectum had a 1-year overall survival (OS) rate of 88.3% (95% CI: 87.1-89.5%), a 3-year OS rate of 75.1% (95% CI: 73.3-77%) and a 5-year OS rate of 64.5% (95% CI: 62-67.1%). Nomograms for 1-, 3- and 5-year CSS predictions were constructed and performed better with a higher C-index than the 7th TNM staging (internal: 0.716 vs 0.663; P < 0.001; external: 0.713 vs 0.647; P < 0.001). Additionally, the nomogram showed good agreement between internal and external validation. According to DCA analysis, compared to the 7th TNM stage, the nomogram showed a greater benefit across the period of follow-up regardless of the internal cohort or external cohort.
Age, race, T stage, pathologic grade, N stage, tumor size and M stage were prognostic factors for both OS and CSS. The constructed nomograms were more effective and accurate for predicting the 1-, 3- and 5-year CSS of patients with adenocarcinoma in villous adenoma than 7th TNM staging.
鉴于结直肠绒毛状腺瘤中腺癌的知识仅限于少数病例报告,我们设计了一项研究来探讨独立的预后因素,并制定预测患者生存的列线图。
采用单因素和多因素 Cox 回归分析评估预后因素。构建预测癌症特异性生存(CSS)的列线图;进行内部和外部验证;通过接收者操作特征(ROC)曲线、C 指数和决策曲线分析进行评估;并与第 7 版 TNM 分期进行比较。
结直肠绒毛状腺瘤中腺癌患者的 1 年总生存率(OS)为 88.3%(95%CI:87.1-89.5%),3 年 OS 率为 75.1%(95%CI:73.3-77%),5 年 OS 率为 64.5%(95%CI:62-67.1%)。构建了 1 年、3 年和 5 年 CSS 预测的列线图,其 C 指数高于第 7 版 TNM 分期,表现更好(内部:0.716 比 0.663;P<0.001;外部:0.713 比 0.647;P<0.001)。此外,列线图在内部和外部验证之间显示出良好的一致性。根据 DCA 分析,与第 7 版 TNM 分期相比,无论内部队列还是外部队列,列线图在整个随访期间都显示出更大的获益。
年龄、种族、T 分期、病理分级、N 分期、肿瘤大小和 M 分期是 OS 和 CSS 的预后因素。与第 7 版 TNM 分期相比,构建的列线图在预测结直肠绒毛状腺瘤中腺癌患者 1 年、3 年和 5 年 CSS 方面更有效、更准确。