Medeiros Felipe A, Jammal Alessandro A, Mariottoni Eduardo B
Vision, Imaging and Performance Laboratory (VIP), Duke Eye Center and Department of Ophthalmology, Duke University, Durham, North Carolina; Department of Electrical and Computer Engineering, Pratt School of Engineering, Duke University, Durham, North Carolina.
Vision, Imaging and Performance Laboratory (VIP), Duke Eye Center and Department of Ophthalmology, Duke University, Durham, North Carolina.
Ophthalmology. 2021 Mar;128(3):383-392. doi: 10.1016/j.ophtha.2020.07.045. Epub 2020 Jul 28.
To investigate whether predictions of retinal nerve fiber layer (RNFL) thickness obtained from a deep learning model applied to fundus photographs can detect progressive glaucomatous changes over time.
Retrospective cohort study.
Eighty-six thousand one hundred twenty-three pairs of color fundus photographs and spectral-domain (SD) OCT images collected during 21 232 visits from 8831 eyes of 5529 patients with glaucoma or glaucoma suspects.
A deep learning convolutional neural network was trained to assess fundus photographs and to predict SD OCT global RNFL thickness measurements. The model then was tested on an independent sample of eyes that had longitudinal follow-up with both fundus photography and SD OCT. The ability to detect eyes that had statistically significant slopes of SD OCT change was assessed by receiver operating characteristic (ROC) curves. The repeatability of RNFL thickness predictions was investigated by measurements obtained from multiple photographs that had been acquired during the same day.
The relationship between change in predicted RNFL thickness from photographs and change in SD OCT RNFL thickness over time.
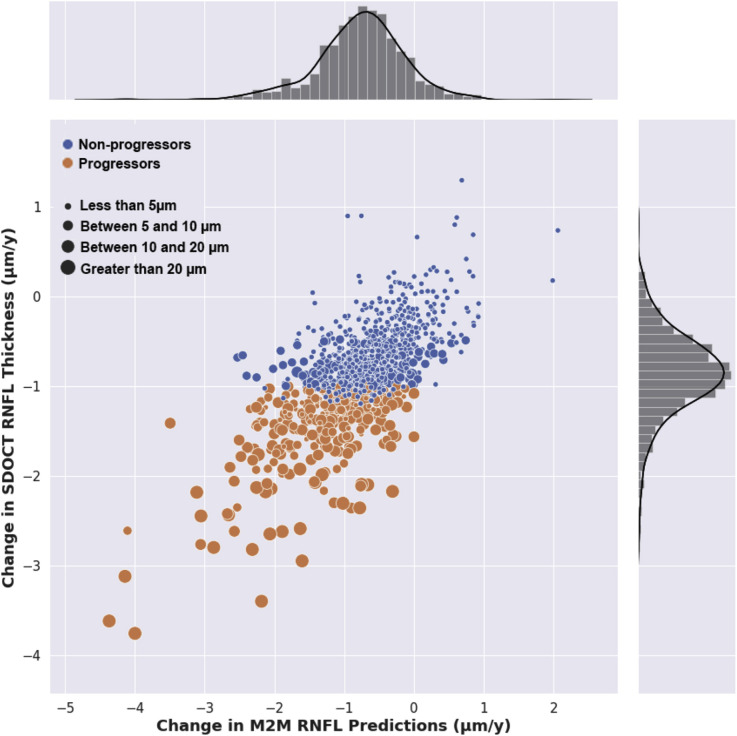
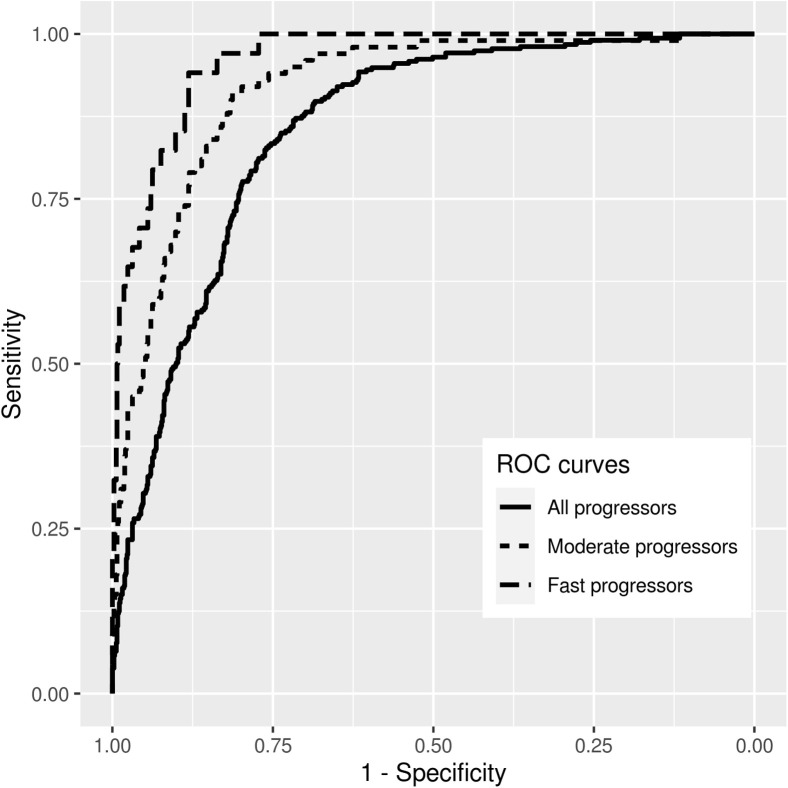
The test sample consisted of 33 466 pairs of fundus photographs and SD OCT images collected during 7125 visits from 1147 eyes of 717 patients. Eyes in the test sample were followed up for an average of 5.3 ± 3.3 years, with an average of 6.2 ± 3.8 visits. A significant correlation was found between change over time in predicted and observed RNFL thickness (r = 0.76; 95% confidence interval [CI], 0.70-0.80; P < 0.001). Retinal nerve fiber layer predictions showed an ROC curve area of 0.86 (95% CI, 0.83-0.88) to discriminate progressors from nonprogressors. For detecting fast progressors (slope faster than 2 μm/year), the ROC curve area was 0.96 (95% CI, 0.94-0.98), with a sensitivity of 97% for 80% specificity and 85% for 90% specificity. For photographs obtained at the same visit, the intraclass correlation coefficient was 0.946 (95% CI, 0.940-0.952), with a coefficient of variation of 3.2% (95% CI, 3.1%-3.3%).
A deep learning model was able to obtain objective and quantitative estimates of RNFL thickness that correlated well with SD OCT measurements and potentially could be used to monitor for glaucomatous changes over time.
研究应用于眼底照片的深度学习模型所获得的视网膜神经纤维层(RNFL)厚度预测值能否检测出随时间推移的青光眼进展性变化。
回顾性队列研究。
5529例青光眼患者或青光眼疑似患者的8831只眼睛在21232次就诊期间收集的86123对彩色眼底照片和光谱域(SD)光学相干断层扫描(OCT)图像。
训练一个深度学习卷积神经网络来评估眼底照片并预测SD OCT的整体RNFL厚度测量值。然后在一个独立的眼睛样本上对该模型进行测试,这些眼睛同时接受了眼底照相和SD OCT的纵向随访。通过受试者操作特征(ROC)曲线评估检测具有统计学显著SD OCT变化斜率的眼睛的能力。通过同一天获取的多张照片的测量值来研究RNFL厚度预测的重复性。
照片预测的RNFL厚度变化与SD OCT RNFL厚度随时间变化之间的关系。
测试样本包括717例患者的1147只眼睛在7125次就诊期间收集的33466对眼底照片和SD OCT图像。测试样本中的眼睛平均随访5.3±3.3年,平均就诊6.2±3.8次。发现预测的和观察到的RNFL厚度随时间的变化之间存在显著相关性(r = 0.76;95%置信区间[CI],0.70 - 0.80;P < 0.001)。视网膜神经纤维层预测显示ROC曲线面积为0.86(95%CI,0.83 - 0.88),用于区分进展者和非进展者。对于检测快速进展者(斜率快于2μm/年),ROC曲线面积为0.96(95%CI,0.94 - 0.98),在特异性为80%时灵敏度为97%,在特异性为90%时灵敏度为85%。对于在同一次就诊时获取的照片,组内相关系数为0.946(95%CI,0.940 - 0.952),变异系数为3.2%(95%CI,3.1% - 3.3%)。
一个深度学习模型能够获得与SD OCT测量值相关性良好的RNFL厚度的客观定量估计值,并有可能用于监测青光眼随时间的变化。