Department of Epidemiology, Nara Medical University School of Medicine, 840 Shijocho, Kashihara, Nara, 634-8521, Japan.
Department of Food Sciences and Nutrition, Mukogawa Women's University, Hyogo, Japan.
Nutr J. 2020 Sep 18;19(1):104. doi: 10.1186/s12937-020-00615-y.
Previous studies have reported that estimates of portion size, energy, and macronutrients such as carbohydrates, proteins, and fat based on the food-photographic record closely correlate with directly weighed values. However, the correlation based on a large sample of the test meal with the evidence of many nutrients is yet to be determined. We conducted this study to assess the correlation and difference between the food-photographic record and weighed results for 44 nutrients based on a larger number of test meals than those in previous studies.
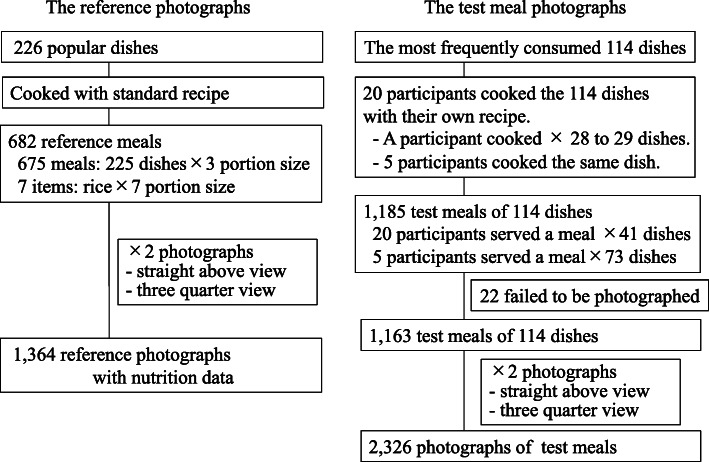
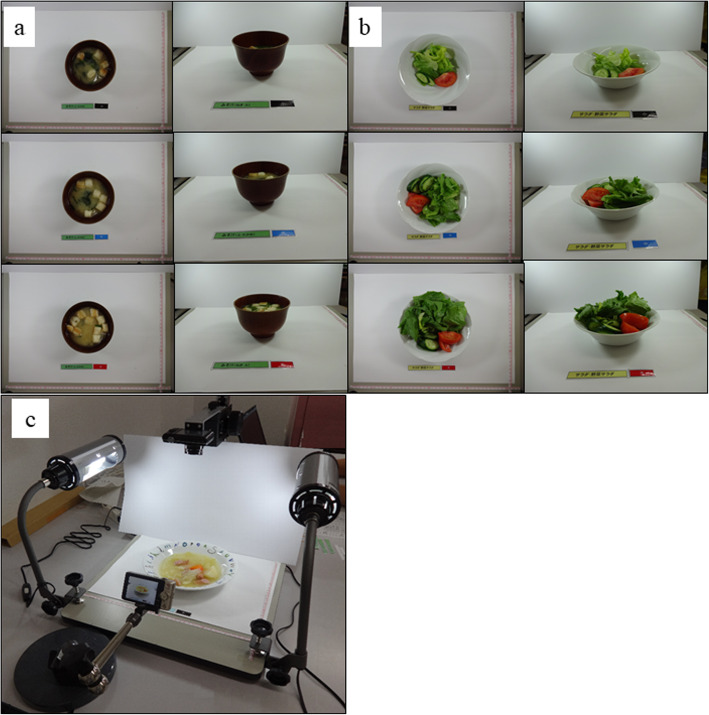
We assessed the nutrients of test meals using a food-photographic record and direct weighing and compared the results of the two methods. Twenty participants prepared a total of 1163 test meals. Each participant cooked 28-29 different kinds of dishes. Five participants cooked the same dish with their own recipes. For the most commonly consumed 41 dishes, 20 participants served a meal with their usual portion size. For the remaining 73 dishes, five participants served a meal with their usual portion size. An independent researcher weighed each ingredient and calculated the nutrients of the test meals. The participants took photographs of the test meals using a digital camera. Two independent, trained analysts measured the longitudinal and transverse diameters of the food area on the photographs of the test meals, compared the portion size with the reference photographs, and calculated the nutrients based on a database that contained reference photographs.
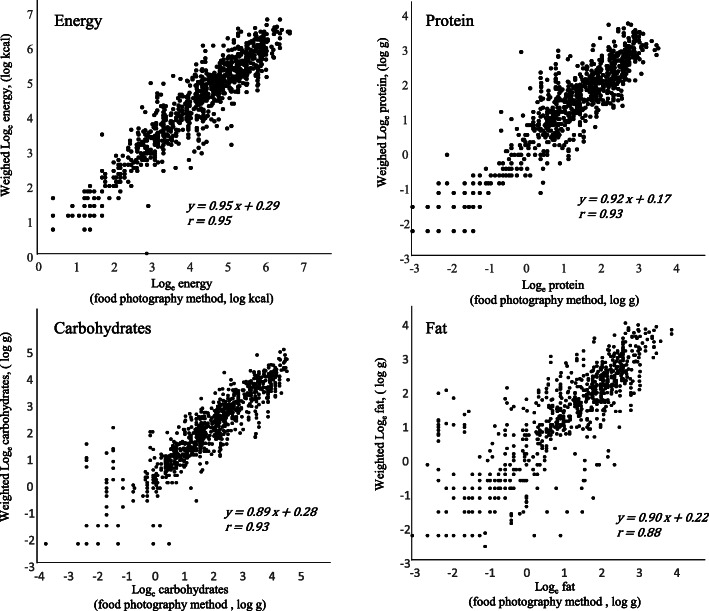
Rank correlation coefficients between estimates from the food-photographic record of each test meal and weighed results were high for portion size (r = 0.93), energy (r = 0.93), protein (r = 0.90), fat (r = 0.92), and carbohydrate (r = 0.94), and those for the 44 nutrients ranged from 0.78 to 0.94. We found high reproducibility between the two analysts for all the nutrients (r > 0.90).
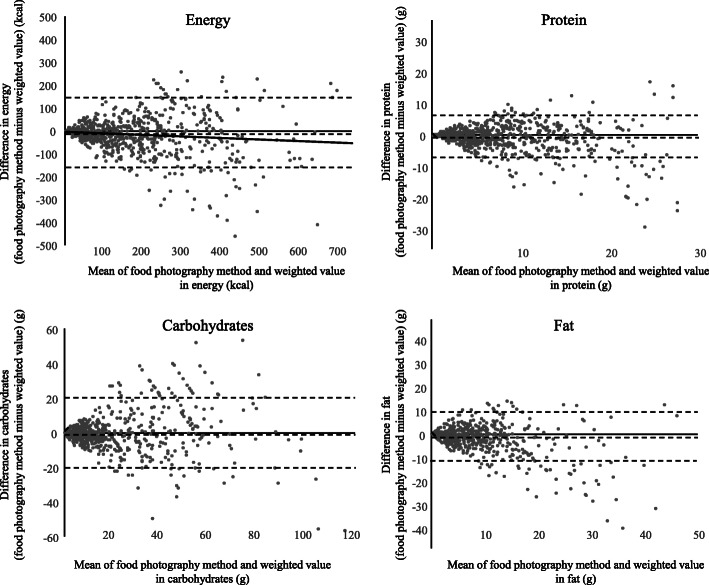
We found a high correlation and small difference between the food-photographic record method and weighed results of a large number of nutrients in many test meals.
先前的研究报告指出,基于食物照片记录的食物份量、能量和宏量营养素(如碳水化合物、蛋白质和脂肪)的估计值与直接称重值密切相关。然而,基于大量测试餐且包含许多营养素证据的相关性尚未确定。我们进行这项研究是为了评估基于比先前研究更多的测试餐,食物照片记录法和称重结果在 44 种营养素方面的相关性和差异。
我们使用食物照片记录法和直接称重法评估测试餐的营养素,并比较两种方法的结果。20 名参与者共准备了 1163 份测试餐。每位参与者烹饪 28-29 种不同的菜肴。其中 5 名参与者使用自己的食谱烹饪相同的菜肴。对于最常食用的 41 道菜,20 名参与者按照自己的常规份量准备一份餐食。对于其余 73 道菜,5 名参与者按照自己的常规份量准备一份餐食。一名独立研究员称重每份食材并计算测试餐的营养素。参与者使用数码相机拍摄测试餐的照片。两位独立的、受过训练的分析师测量测试餐照片上食物区域的长径和短径,将份量与参考照片进行比较,并根据包含参考照片的数据库计算营养素。
每份测试餐的食物照片记录法估计值与称重结果之间的等级相关系数均较高,用于份量(r=0.93)、能量(r=0.93)、蛋白质(r=0.90)、脂肪(r=0.92)和碳水化合物(r=0.94),44 种营养素的相关系数范围为 0.78 至 0.94。我们发现两位分析师对所有营养素的重复性都很高(r>0.90)。
我们发现,在大量测试餐中,食物照片记录法和称重结果在许多营养素方面具有高度相关性和较小差异。