• 文献检索
  • 文档翻译
  • 深度研究
  • 学术资讯
  • Suppr Zotero 插件Zotero 插件
  • 邀请有礼
  • 套餐&价格
  • 历史记录
应用&插件
Suppr Zotero 插件Zotero 插件浏览器插件Mac 客户端Windows 客户端微信小程序
定价
高级版会员购买积分包购买API积分包
服务
文献检索文档翻译深度研究API 文档MCP 服务
关于我们
关于 Suppr公司介绍联系我们用户协议隐私条款
关注我们

Suppr 超能文献

核心技术专利:CN118964589B侵权必究
粤ICP备2023148730 号-1Suppr @ 2026

文献检索

告别复杂PubMed语法,用中文像聊天一样搜索,搜遍4000万医学文献。AI智能推荐,让科研检索更轻松。

立即免费搜索

文件翻译

保留排版,准确专业,支持PDF/Word/PPT等文件格式,支持 12+语言互译。

免费翻译文档

深度研究

AI帮你快速写综述,25分钟生成高质量综述,智能提取关键信息,辅助科研写作。

立即免费体验

微生物组探索者:一个用于微生物群落分析和可视化的 R 包。

MicrobiomeExplorer: an R package for the analysis and visualization of microbial communities.

机构信息

Department of OMNI Bioinformatics, Genentech, Inc, South San Francisco, CA 94080, USA.

Department of Statistics, The Wharton School, University of Pennsylvania, Philadelphia, PA 19104, USA.

出版信息

Bioinformatics. 2021 Jun 9;37(9):1317-1318. doi: 10.1093/bioinformatics/btaa838.

DOI:10.1093/bioinformatics/btaa838
PMID:32960962
原文链接:https://pmc.ncbi.nlm.nih.gov/articles/PMC8193707/
Abstract

SUMMARY

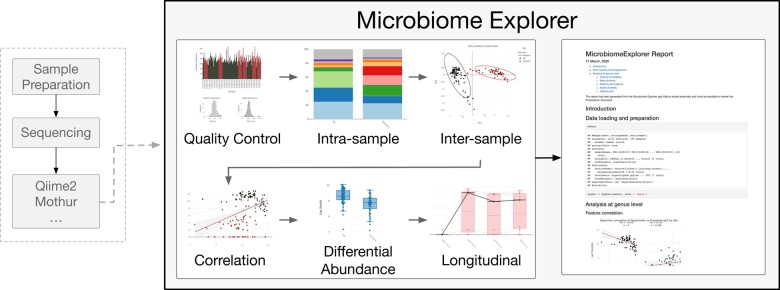
We developed the MicrobiomeExplorer R package to facilitate the analysis and visualization of microbial communities. The MicrobiomeExplorer R package allows a user to perform typical microbiome analytic workflows and visualize their results, either through the command line or an interactive Shiny application included with the package. In addition to applying common analytical workflows, the application enables automated analysis report generation.

AVAILABILITY AND IMPLEMENTATION

Available at https://github.com/zoecastillo/microbiomeExplorer.

SUPPLEMENTARY INFORMATION

Supplementary data are available at Bioinformatics online.

摘要

摘要

我们开发了 MicrobiomeExplorer R 包,以方便微生物群落的分析和可视化。MicrobiomeExplorer R 包允许用户通过命令行或包含在包中的交互式 Shiny 应用程序执行典型的微生物组分析工作流程并可视化其结果。除了应用常见的分析工作流程外,该应用程序还支持自动分析报告生成。

可用性和实现

可在 https://github.com/zoecastillo/microbiomeExplorer 上获得。

补充信息

补充数据可在 Bioinformatics 在线获得。

https://cdn.ncbi.nlm.nih.gov/pmc/blobs/ae93/8193707/16b2be0c8a27/btaa838f1.jpg

相似文献

1
MicrobiomeExplorer: an R package for the analysis and visualization of microbial communities.微生物组探索者:一个用于微生物群落分析和可视化的 R 包。
Bioinformatics. 2021 Jun 9;37(9):1317-1318. doi: 10.1093/bioinformatics/btaa838.
2
microbiomeMarker: an R/Bioconductor package for microbiome marker identification and visualization.microbiomeMarker:一个用于微生物组标记物识别和可视化的 R/Bioconductor 包。
Bioinformatics. 2022 Aug 10;38(16):4027-4029. doi: 10.1093/bioinformatics/btac438.
3
Chordomics: a visualization tool for linking function to phylogeny in microbiomes.弦理论组学:一种将功能与微生物组系统发育联系起来的可视化工具。
Bioinformatics. 2020 Feb 15;36(4):1309-1310. doi: 10.1093/bioinformatics/btz711.
4
animalcules: interactive microbiome analytics and visualization in R.微生物组分析与可视化 R 语言工具包
Microbiome. 2021 Mar 28;9(1):76. doi: 10.1186/s40168-021-01013-0.
5
netGO: R-Shiny package for network-integrated pathway enrichment analysis.netGO:用于网络集成通路富集分析的 R-Shiny 软件包。
Bioinformatics. 2020 May 1;36(10):3283-3285. doi: 10.1093/bioinformatics/btaa077.
6
spatialTIME and iTIME: R package and Shiny application for visualization and analysis of immunofluorescence data.spatialTIME 和 iTIME:用于免疫荧光数据可视化和分析的 R 包和 Shiny 应用程序。
Bioinformatics. 2021 Dec 7;37(23):4584-4586. doi: 10.1093/bioinformatics/btab757.
7
powmic: an R package for power assessment in microbiome case-control studies.powmic:用于微生物组病例对照研究中功效评估的 R 包。
Bioinformatics. 2020 Jun 1;36(11):3563-3565. doi: 10.1093/bioinformatics/btaa197.
8
mapDATAge: a ShinyR package to chart ancient DNA data through space and time.mapDATAge:一个用于通过空间和时间展示古 DNA 数据的 ShinyR 包。
Bioinformatics. 2022 Aug 10;38(16):3992-3994. doi: 10.1093/bioinformatics/btac425.
9
NetCoMi: network construction and comparison for microbiome data in R.NetCoMi:用于微生物组数据的网络构建和比较的 R 包。
Brief Bioinform. 2021 Jul 20;22(4). doi: 10.1093/bib/bbaa290.
10
ngsReports: a Bioconductor package for managing FastQC reports and other NGS related log files.ngsReports:一个用于管理 FastQC 报告和其他与 NGS 相关的日志文件的 Bioconductor 包。
Bioinformatics. 2020 Apr 15;36(8):2587-2588. doi: 10.1093/bioinformatics/btz937.

引用本文的文献

1
First-year dynamics of the anaerobic microbiome and archaeome in infants' oral and gastrointestinal systems.婴儿口腔和胃肠道系统中厌氧微生物组和古菌组的第一年动态变化。
mSystems. 2025 Jan 21;10(1):e0107124. doi: 10.1128/msystems.01071-24. Epub 2024 Dec 23.
2
In-hospital areas with distinct maintenance and staff/patient traffic have specific microbiome profiles, functions, and resistomes.具有明确维护和人员/患者流量的医院内区域具有特定的微生物组特征、功能和抗药性组。
mSystems. 2024 Aug 20;9(8):e0072624. doi: 10.1128/msystems.00726-24. Epub 2024 Jul 9.
3
The dynamics of the female microbiome: unveiling abrupt changes of microbial domains across body sites from prepartum to postpartum phases.

本文引用的文献

1
Metaviz: interactive statistical and visual analysis of metagenomic data.Metaviz:宏基因组数据的交互式统计和可视化分析。
Nucleic Acids Res. 2018 Apr 6;46(6):2777-2787. doi: 10.1093/nar/gky136.
2
Mentholation affects the cigarette microbiota by selecting for bacteria resistant to harsh environmental conditions and selecting against potential bacterial pathogens.薄荷醇通过选择耐受恶劣环境条件的细菌和选择潜在的细菌病原体来影响香烟微生物群。
Microbiome. 2017 Feb 15;5(1):22. doi: 10.1186/s40168-017-0235-0.
3
Differential abundance analysis for microbial marker-gene surveys.
女性微生物组的动态变化:揭示从产前到产后阶段微生物域在身体各部位的突然变化。
Microbiol Spectr. 2024 Jun 25;12(8):e0014724. doi: 10.1128/spectrum.00147-24.
4
Snowflake: visualizing microbiome abundance tables as multivariate bipartite graphs.雪花:将微生物群落丰度表可视化为多元二分图。
Front Bioinform. 2024 Feb 5;4:1331043. doi: 10.3389/fbinf.2024.1331043. eCollection 2024.
5
Antibiotic prophylaxis and hospitalization of horses subjected to median laparotomy: gut microbiota trajectories and abundance increase of .接受正中剖腹术马匹的抗生素预防和住院治疗:肠道微生物群轨迹及……丰度增加
Front Microbiol. 2023 Nov 23;14:1228845. doi: 10.3389/fmicb.2023.1228845. eCollection 2023.
6
relative abundance in shower hose biofilms is associated with specific microbiome members.淋浴喷头生物膜中的相对丰度与特定的微生物群落成员相关。
FEMS Microbes. 2023 Aug 16;4:xtad016. doi: 10.1093/femsmc/xtad016. eCollection 2023.
7
ggpicrust2: an R package for PICRUSt2 predicted functional profile analysis and visualization.ggpicrust2:一个用于 PICRUSt2 预测功能谱分析和可视化的 R 包。
Bioinformatics. 2023 Aug 1;39(8). doi: 10.1093/bioinformatics/btad470.
8
Dissecting the human gut microbiome to better decipher drug liability: A once-forgotten organ takes center stage.剖析人类肠道微生物群以更好地解读药物安全性:一个曾被遗忘的器官成为焦点。
J Adv Res. 2023 Oct;52:171-201. doi: 10.1016/j.jare.2023.07.002. Epub 2023 Jul 5.
9
Contamination detection and microbiome exploration with GRIMER.使用 GRIMER 进行污染检测和微生物组探索。
Gigascience. 2022 Dec 28;12. doi: 10.1093/gigascience/giad017. Epub 2023 Mar 30.
10
Clinical NEC prevention practices drive different microbiome profiles and functional responses in the preterm intestine.临床 NEC 预防措施可改变早产儿肠道的微生物组特征和功能反应。
Nat Commun. 2023 Mar 11;14(1):1349. doi: 10.1038/s41467-023-36825-1.
微生物标记基因调查的差异丰度分析。
Nat Methods. 2013 Dec;10(12):1200-2. doi: 10.1038/nmeth.2658. Epub 2013 Sep 29.