• 文献检索
  • 文档翻译
  • 深度研究
  • 学术资讯
  • Suppr Zotero 插件Zotero 插件
  • 邀请有礼
  • 套餐&价格
  • 历史记录
应用&插件
Suppr Zotero 插件Zotero 插件浏览器插件Mac 客户端Windows 客户端微信小程序
定价
高级版会员购买积分包购买API积分包
服务
文献检索文档翻译深度研究API 文档MCP 服务
关于我们
关于 Suppr公司介绍联系我们用户协议隐私条款
关注我们

Suppr 超能文献

核心技术专利:CN118964589B侵权必究
粤ICP备2023148730 号-1Suppr @ 2026

文献检索

告别复杂PubMed语法,用中文像聊天一样搜索,搜遍4000万医学文献。AI智能推荐,让科研检索更轻松。

立即免费搜索

文件翻译

保留排版,准确专业,支持PDF/Word/PPT等文件格式,支持 12+语言互译。

免费翻译文档

深度研究

AI帮你快速写综述,25分钟生成高质量综述,智能提取关键信息,辅助科研写作。

立即免费体验

基于初始临床和 CT 特征的严重 2019 冠状病毒病(COVID-19)识别列线图:一项多中心研究。

Nomogram to identify severe coronavirus disease 2019 (COVID-19) based on initial clinical and CT characteristics: a multi-center study.

机构信息

Department of Radiology, The First Affiliated Hospital of Soochow University, No.188, Shi Zi Street, Suzhou, 215006, Jiangsu, China.

Department of Radiology, The Affiliated Infectious Diseases Hospital of Soochow University, Suzhou, 215000, China.

出版信息

BMC Med Imaging. 2020 Oct 2;20(1):111. doi: 10.1186/s12880-020-00513-z.

DOI:10.1186/s12880-020-00513-z
PMID:33008329
原文链接:https://pmc.ncbi.nlm.nih.gov/articles/PMC7530870/
Abstract

BACKGROUND

To develop and validate a nomogram for early identification of severe coronavirus disease 2019 (COVID-19) based on initial clinical and CT characteristics.

METHODS

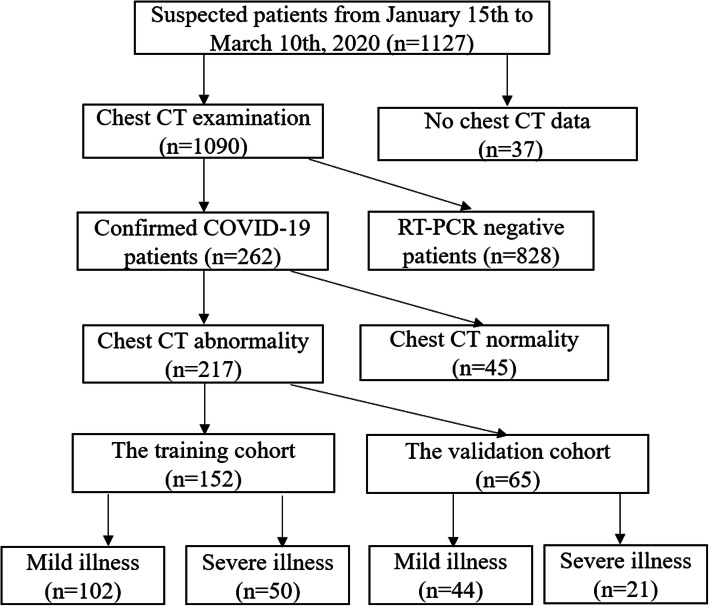
The initial clinical and CT imaging data of 217 patients with COVID-19 were analyzed retrospectively from January to March 2020. Two hundred seventeen patients with 146 mild cases and 71 severe cases were randomly divided into training and validation cohorts. Independent risk factors were selected to construct the nomogram for predicting severe COVID-19. Nomogram performance in terms of discrimination and calibration ability was evaluated using the area under the curve (AUC), calibration curve, decision curve, clinical impact curve and risk chart.

RESULTS

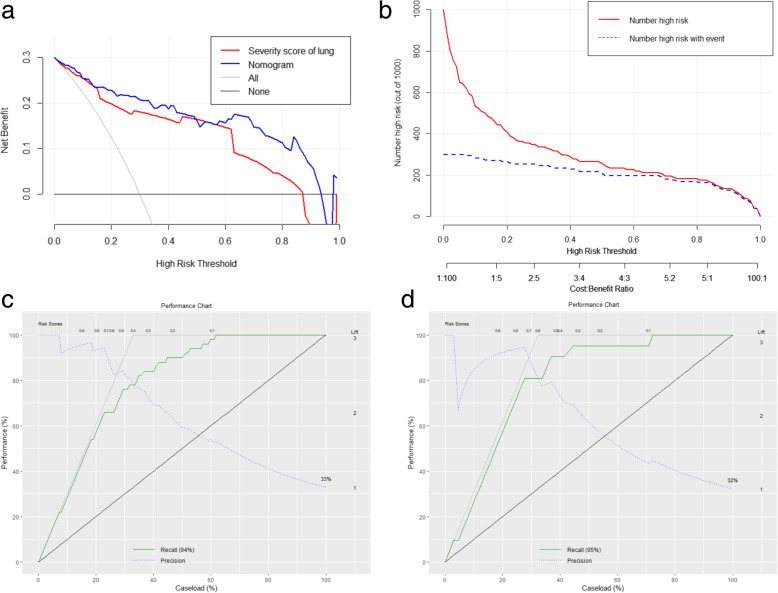
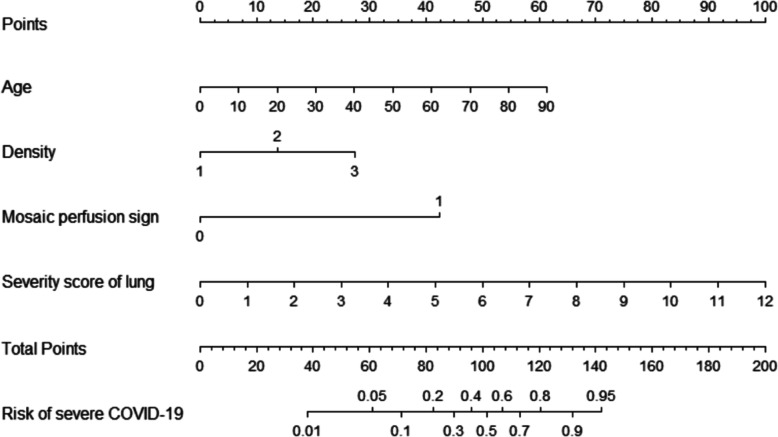
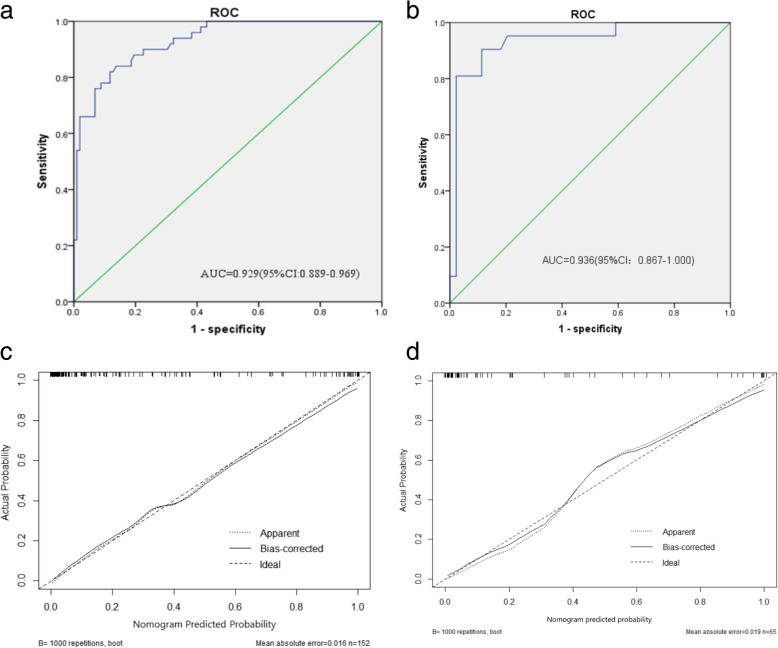
In the training cohort, the severity score of lung in the severe group (7, interquartile range [IQR]:5-9) was significantly higher than that of the mild group (4, IQR,2-5) (P < 0.001). Age, density, mosaic perfusion sign and severity score of lung were independent risk factors for severe COVID-19. The nomogram had a AUC of 0.929 (95% CI, 0.889-0.969), sensitivity of 84.0% and specificity of 86.3%, in the training cohort, and a AUC of 0.936 (95% CI, 0.867-1.000), sensitivity of 90.5% and specificity of 88.6% in the validation cohort. The calibration curve, decision curve, clinical impact curve and risk chart showed that nomogram had high accuracy and superior net benefit in predicting severe COVID-19.

CONCLUSION

The nomogram incorporating initial clinical and CT characteristics may help to identify the severe patients with COVID-19 in the early stage.

摘要

背景

为了基于初始临床和 CT 特征,开发并验证一种用于早期识别严重 2019 冠状病毒病(COVID-19)的列线图。

方法

回顾性分析 2020 年 1 月至 3 月期间 217 例 COVID-19 患者的初始临床和 CT 影像学数据。将 217 例患者随机分为训练队列和验证队列,其中 146 例为轻症,71 例为重症。选择独立的危险因素来构建预测严重 COVID-19 的列线图。使用曲线下面积(AUC)、校准曲线、决策曲线、临床影响曲线和风险图表评估列线图在区分能力和校准能力方面的表现。

结果

在训练队列中,重症组(7 分,四分位距 [IQR]:5-9)的肺部严重程度评分明显高于轻症组(4 分,IQR:2-5)(P < 0.001)。年龄、密度、马赛克灌注征和肺部严重程度评分是严重 COVID-19 的独立危险因素。该列线图在训练队列中的 AUC 为 0.929(95%CI,0.889-0.969),敏感性为 84.0%,特异性为 86.3%,在验证队列中的 AUC 为 0.936(95%CI,0.867-1.000),敏感性为 90.5%,特异性为 88.6%。校准曲线、决策曲线、临床影响曲线和风险图表表明,该列线图在预测严重 COVID-19 方面具有较高的准确性和优势净收益。

结论

纳入初始临床和 CT 特征的列线图有助于在早期识别 COVID-19 重症患者。

https://cdn.ncbi.nlm.nih.gov/pmc/blobs/d24e/7532583/de2d4b18d4f9/12880_2020_513_Fig7_HTML.jpg
https://cdn.ncbi.nlm.nih.gov/pmc/blobs/d24e/7532583/6cbeaa8b16a8/12880_2020_513_Fig1_HTML.jpg
https://cdn.ncbi.nlm.nih.gov/pmc/blobs/d24e/7532583/93512a2ceccc/12880_2020_513_Fig2_HTML.jpg
https://cdn.ncbi.nlm.nih.gov/pmc/blobs/d24e/7532583/6a2077e8dc19/12880_2020_513_Fig3_HTML.jpg
https://cdn.ncbi.nlm.nih.gov/pmc/blobs/d24e/7532583/3868deb5d9ff/12880_2020_513_Fig4_HTML.jpg
https://cdn.ncbi.nlm.nih.gov/pmc/blobs/d24e/7532583/9e2d7e636e61/12880_2020_513_Fig5_HTML.jpg
https://cdn.ncbi.nlm.nih.gov/pmc/blobs/d24e/7532583/e92e8937f080/12880_2020_513_Fig6_HTML.jpg
https://cdn.ncbi.nlm.nih.gov/pmc/blobs/d24e/7532583/de2d4b18d4f9/12880_2020_513_Fig7_HTML.jpg

相似文献

1
Nomogram to identify severe coronavirus disease 2019 (COVID-19) based on initial clinical and CT characteristics: a multi-center study.基于初始临床和 CT 特征的严重 2019 冠状病毒病(COVID-19)识别列线图:一项多中心研究。
BMC Med Imaging. 2020 Oct 2;20(1):111. doi: 10.1186/s12880-020-00513-z.
2
A diagnostic model for coronavirus disease 2019 (COVID-19) based on radiological semantic and clinical features: a multi-center study.基于放射学语义和临床特征的 2019 年冠状病毒病(COVID-19)诊断模型:一项多中心研究。
Eur Radiol. 2020 Sep;30(9):4893-4902. doi: 10.1007/s00330-020-06829-2. Epub 2020 Apr 16.
3
Radiomics nomogram for the prediction of 2019 novel coronavirus pneumonia caused by SARS-CoV-2.基于影像组学的 2019 年新型冠状病毒肺炎(COVID-19)严重程度预测列线图模型。
Eur Radiol. 2020 Dec;30(12):6888-6901. doi: 10.1007/s00330-020-07032-z. Epub 2020 Jul 3.
4
A Tool for Early Prediction of Severe Coronavirus Disease 2019 (COVID-19): A Multicenter Study Using the Risk Nomogram in Wuhan and Guangdong, China.一种用于早期预测严重 2019 冠状病毒病(COVID-19)的工具:来自中国武汉和广东的多中心研究使用风险列线图。
Clin Infect Dis. 2020 Jul 28;71(15):833-840. doi: 10.1093/cid/ciaa443.
5
Development and validation a nomogram for predicting the risk of severe COVID-19: A multi-center study in Sichuan, China.开发和验证预测严重 COVID-19 风险的列线图:来自中国四川的一项多中心研究。
PLoS One. 2020 May 18;15(5):e0233328. doi: 10.1371/journal.pone.0233328. eCollection 2020.
6
Development and Validation of a Prognostic Nomogram Based on Clinical and CT Features for Adverse Outcome Prediction in Patients with COVID-19.基于临床和 CT 特征的 COVID-19 不良结局预测预后列线图的建立与验证。
Korean J Radiol. 2020 Aug;21(8):1007-1017. doi: 10.3348/kjr.2020.0485.
7
Artificial Intelligence Augmentation of Radiologist Performance in Distinguishing COVID-19 from Pneumonia of Other Origin at Chest CT.人工智能增强放射科医生在胸部 CT 上区分 COVID-19 与其他病因肺炎的性能。
Radiology. 2020 Sep;296(3):E156-E165. doi: 10.1148/radiol.2020201491. Epub 2020 Apr 27.
8
CT Quantitative Analysis and Its Relationship with Clinical Features for Assessing the Severity of Patients with COVID-19.CT 定量分析及其与临床特征的关系,用于评估 COVID-19 患者的严重程度。
Korean J Radiol. 2020 Jul;21(7):859-868. doi: 10.3348/kjr.2020.0293.
9
Analysis of clinical features and imaging signs of COVID-19 with the assistance of artificial intelligence.人工智能辅助分析 COVID-19 的临床特征和影像征象。
Eur Rev Med Pharmacol Sci. 2020 Aug;24(15):8210-8218. doi: 10.26355/eurrev_202008_22510.
10
Construction and validation of a machine learning-based nomogram: A tool to predict the risk of getting severe coronavirus disease 2019 (COVID-19).基于机器学习的列线图的构建与验证:预测 2019 年冠状病毒病(COVID-19)重症风险的工具。
Immun Inflamm Dis. 2021 Jun;9(2):595-607. doi: 10.1002/iid3.421. Epub 2021 Mar 13.

引用本文的文献

1
Risk factors and clinical prediction models for low-level viremia in people living with HIV receiving antiretroviral therapy: an 11-year retrospective study.接受抗逆转录病毒治疗的HIV感染者低水平病毒血症的危险因素及临床预测模型:一项11年的回顾性研究
Front Microbiol. 2024 Nov 1;15:1451201. doi: 10.3389/fmicb.2024.1451201. eCollection 2024.
2
HB-EGF Plasmatic Level Contributes to the Development of Early Risk Prediction Nomogram for Severe COVID-19 Cases.HB-EGF血浆水平有助于构建重症COVID-19病例早期风险预测列线图。
Biomedicines. 2024 Feb 5;12(2):373. doi: 10.3390/biomedicines12020373.
3
Risk factors for disease severity among children with Covid-19: a clinical prediction model.

本文引用的文献

1
Temporal Changes of CT Findings in 90 Patients with COVID-19 Pneumonia: A Longitudinal Study.90 例 COVID-19 肺炎患者 CT 表现的时间变化:一项纵向研究。
Radiology. 2020 Aug;296(2):E55-E64. doi: 10.1148/radiol.2020200843. Epub 2020 Mar 19.
2
Clinical and High-Resolution CT Features of the COVID-19 Infection: Comparison of the Initial and Follow-up Changes.COVID-19 感染的临床和高分辨率 CT 特征:初始与随访变化比较。
Invest Radiol. 2020 Jun;55(6):332-339. doi: 10.1097/RLI.0000000000000674.
3
Clinical characteristics and imaging manifestations of the 2019 novel coronavirus disease (COVID-19):A multi-center study in Wenzhou city, Zhejiang, China.
儿童 COVID-19 疾病严重程度的危险因素:临床预测模型。
BMC Infect Dis. 2023 Jun 12;23(1):398. doi: 10.1186/s12879-023-08357-y.
4
Validation of the RIM Score-COVID in the Spanish SEMI-COVID-19 Registry.验证 RIM 评分-COVID 在西班牙 SEMI-COVID-19 登记处的应用。
Intern Emerg Med. 2023 Apr;18(3):907-915. doi: 10.1007/s11739-023-03200-3. Epub 2023 Jan 21.
5
Machine learning models to predict the maximum severity of COVID-19 based on initial hospitalization record.基于初始住院记录的机器学习模型预测 COVID-19 最大严重程度。
Front Public Health. 2022 Nov 28;10:1007205. doi: 10.3389/fpubh.2022.1007205. eCollection 2022.
6
Construction of a nomogram for predicting COVID-19 in-hospital mortality: A machine learning analysis.构建用于预测COVID-19院内死亡率的列线图:机器学习分析
Inform Med Unlocked. 2023;36:101138. doi: 10.1016/j.imu.2022.101138. Epub 2022 Dec 2.
7
An End-to-End Integrated Clinical and CT-Based Radiomics Nomogram for Predicting Disease Severity and Need for Ventilator Support in COVID-19 Patients: A Large Multisite Retrospective Study.一种用于预测COVID-19患者疾病严重程度和呼吸机支持需求的端到端综合临床和基于CT的影像组学列线图:一项大型多中心回顾性研究
Front Radiol. 2022;2. doi: 10.3389/fradi.2022.781536. Epub 2022 Apr 8.
8
A nomogram predicting the severity of COVID-19 based on initial clinical and radiologic characteristics.一种基于初始临床和放射学特征预测新型冠状病毒肺炎严重程度的列线图。
Future Virol. 2022 Jan. doi: 10.2217/fvl-2020-0193. Epub 2022 Feb 21.
9
Risk Factors of In-Hospital Mortality in Non-Specialized Tertiary Center Repurposed for Medical Care to COVID-19 Patients in Russia.俄罗斯将非专科三级医疗中心改造用于治疗新冠患者时院内死亡的危险因素
Diagnostics (Basel). 2021 Sep 15;11(9):1687. doi: 10.3390/diagnostics11091687.
10
Development and validation of nomogram to predict severe illness requiring intensive care follow up in hospitalized COVID-19 cases.建立并验证列线图预测 COVID-19 住院患者需要重症监护随访的严重疾病风险。
BMC Infect Dis. 2021 Sep 25;21(1):1004. doi: 10.1186/s12879-021-06656-w.
中国浙江省温州市多中心研究:2019 年新型冠状病毒病(COVID-19)的临床特征和影像学表现。
J Infect. 2020 Apr;80(4):388-393. doi: 10.1016/j.jinf.2020.02.016. Epub 2020 Feb 26.
4
Imaging and clinical features of patients with 2019 novel coronavirus SARS-CoV-2.新型冠状病毒 2019 年 SARS-CoV-2 患者的影像学和临床特征。
Eur J Nucl Med Mol Imaging. 2020 May;47(5):1275-1280. doi: 10.1007/s00259-020-04735-9. Epub 2020 Feb 28.
5
Pathological findings of COVID-19 associated with acute respiratory distress syndrome.与急性呼吸窘迫综合征相关的新型冠状病毒肺炎的病理表现
Lancet Respir Med. 2020 Apr;8(4):420-422. doi: 10.1016/S2213-2600(20)30076-X. Epub 2020 Feb 18.
6
Coronavirus Disease 2019 (COVID-19): A Perspective from China.2019 冠状病毒病(COVID-19):来自中国的视角。
Radiology. 2020 Aug;296(2):E15-E25. doi: 10.1148/radiol.2020200490. Epub 2020 Feb 21.
7
Clinical Characteristics of 138 Hospitalized Patients With 2019 Novel Coronavirus-Infected Pneumonia in Wuhan, China.《武汉 2019 年新型冠状病毒感染的肺炎 138 例住院患者临床特征分析》
JAMA. 2020 Mar 17;323(11):1061-1069. doi: 10.1001/jama.2020.1585.
8
CT Imaging Features of 2019 Novel Coronavirus (2019-nCoV).2019 新型冠状病毒(2019-nCoV)的 CT 影像学特征。
Radiology. 2020 Apr;295(1):202-207. doi: 10.1148/radiol.2020200230. Epub 2020 Feb 4.
9
A familial cluster of pneumonia associated with the 2019 novel coronavirus indicating person-to-person transmission: a study of a family cluster.一个涉及 2019 年新型冠状病毒的家庭聚集性肺炎病例,提示存在人际传播:一项家庭聚集性研究。
Lancet. 2020 Feb 15;395(10223):514-523. doi: 10.1016/S0140-6736(20)30154-9. Epub 2020 Jan 24.
10
Development and Validation of a Simple-to-Use Nomogram for Predicting 5-, 10-, and 15-Year Survival in Asymptomatic Adults Undergoing Coronary Artery Calcium Scoring.无症状成年人冠状动脉钙化评分后 5 年、10 年和 15 年生存的简易列线图的开发和验证。
JACC Cardiovasc Imaging. 2018 Mar;11(3):450-458. doi: 10.1016/j.jcmg.2017.03.018. Epub 2017 Jun 14.