Translational Research in Gastrointestinal Disorders, Department of Chronic Diseases, Metabolism and Aging, KU Leuven, Leuven, Belgium.
Nutrition & Obesity Unit, Clinical and Experimental Endocrinology, Department of Chronic Diseases, Metabolism and Aging, KU Leuven, Leuven, Belgium.
J Med Internet Res. 2020 Oct 21;22(10):e18237. doi: 10.2196/18237.
Digital food registration via online platforms that are coupled to large food databases obviates the need for manual processing of dietary data. The reliability of such platforms depends on the quality of the associated food database.
In this study, we validate the database of MyFitnessPal versus the Belgian food composition database, Nubel.
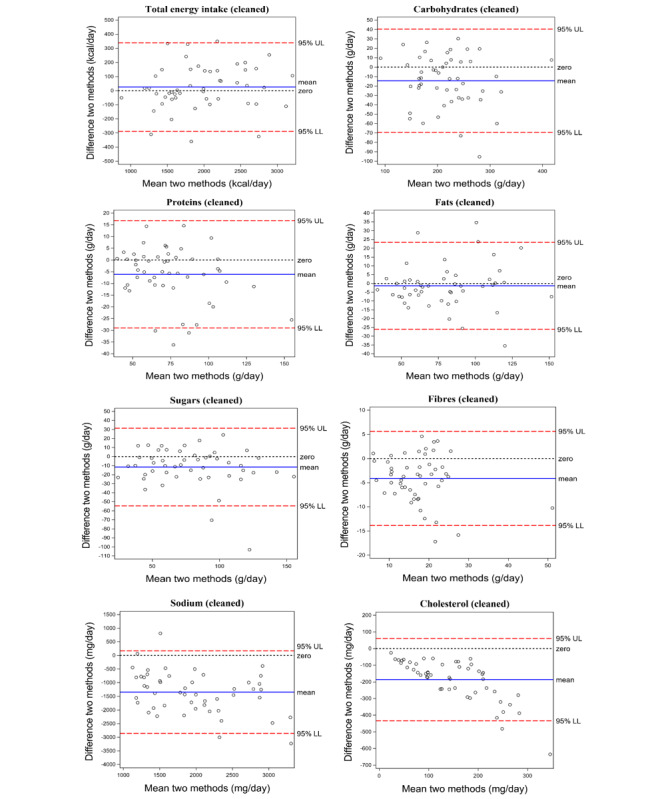
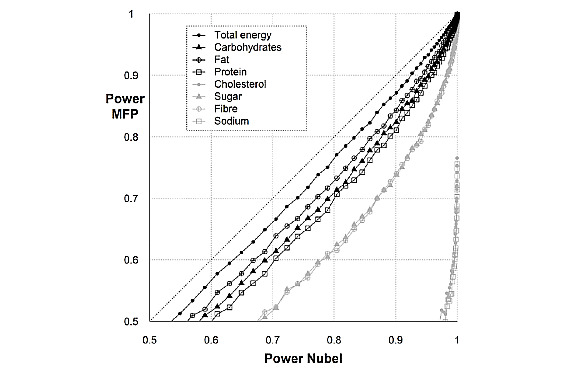
After carefully given instructions, 50 participants used MyFitnessPal to each complete a 4-day dietary record 2 times (T1 and T2), with 1 month in between T1 and T2. Nutrient intake values were calculated either manually, using the food composition database Nubel, or automatically, using the database coupled to MyFitnessPal. First, nutrient values from T1 were used as a training set to develop an algorithm that defined upper limit values for energy intake, carbohydrates, fat, protein, fiber, sugar, cholesterol, and sodium. These limits were applied to the MyFitnessPal dataset extracted at T2 to remove extremely high and likely erroneous values. Original and cleaned T2 values were correlated with the Nubel calculated values. Bias was estimated using Bland-Altman plots. Finally, we simulated the impact of using MyFitnessPal for nutrient analysis instead of Nubel on the power of a study design that correlates nutrient intake to a chosen outcome variable.
Per food portion, the following upper limits were defined: 1500 kilocalories for total energy intake, 95 grams (g) for carbohydrates, 92 g for fat, 52 g for protein, 22 g for fiber, 70 g for sugar, 600 mg for cholesterol, and 3600 mg for sodium. Cleaning the dataset extracted at T2 resulted in a 2.8% rejection. Cleaned MyFitnessPal values demonstrated strong correlations with Nubel for energy intake (r=0.96), carbohydrates (r=0.90), fat (r=0.90), protein (r=0.90), fiber (r=0.80), and sugar (r=0.79), but weak correlations for cholesterol (ρ=0.51) and sodium (ρ=0.53); all P values were ≤.001. No bias was found between both methods, except for a fixed bias for fiber and a proportional bias for cholesterol. A 5-10% power loss should be taken into account when correlating energy intake and macronutrients obtained with MyFitnessPal to an outcome variable, compared to Nubel.
Dietary analysis with MyFitnessPal is accurate and efficient for total energy intake, macronutrients, sugar, and fiber, but not for cholesterol and sodium.
通过与大型食品数据库耦合的在线平台进行数字化食品登记,免去了对饮食数据进行人工处理的需要。这种平台的可靠性取决于相关食品数据库的质量。
在这项研究中,我们验证了 MyFitnessPal 数据库与比利时食品成分数据库 Nubel 的匹配程度。
在仔细指导后,50 名参与者使用 MyFitnessPal 完成了两次(T1 和 T2)为期 4 天的饮食记录,两次记录之间间隔 1 个月。营养素摄入量值通过手动计算,使用 Nubel 食品成分数据库,或自动计算,使用与 MyFitnessPal 耦合的数据库。首先,使用 T1 的营养素值作为训练集,开发一种算法来定义能量摄入、碳水化合物、脂肪、蛋白质、纤维、糖、胆固醇和钠的上限值。这些限制应用于 T2 时从 MyFitnessPal 提取的数据集中,以去除可能存在的极高和错误值。原始和清理后的 T2 值与 Nubel 计算值相关联。使用 Bland-Altman 图估计偏差。最后,我们模拟了使用 MyFitnessPal 进行营养分析而不是使用 Nubel 对与所选结果变量相关的营养素摄入进行研究设计的影响。
对于每份食物,定义了以下上限值:总能量摄入 1500 卡路里,碳水化合物 95 克,脂肪 92 克,蛋白质 52 克,纤维 22 克,糖 70 克,胆固醇 600 毫克,钠 3600 毫克。清理 T2 时提取的数据集中,有 2.8%被拒绝。清理后的 MyFitnessPal 值与 Nubel 之间的能量摄入(r=0.96)、碳水化合物(r=0.90)、脂肪(r=0.90)、蛋白质(r=0.90)、纤维(r=0.80)和糖(r=0.79)具有很强的相关性,但胆固醇(ρ=0.51)和钠(ρ=0.53)的相关性较弱;所有 P 值均≤.001。两种方法之间没有发现偏差,除了纤维的固定偏差和胆固醇的比例偏差。与使用 Nubel 相比,当将 MyFitnessPal 获得的能量摄入和宏量营养素与结果变量相关联时,应该考虑到 5%至 10%的能量损失。
使用 MyFitnessPal 进行饮食分析对于总能量摄入、宏量营养素、糖和纤维是准确和高效的,但对于胆固醇和钠则不然。