• 文献检索
  • 文档翻译
  • 深度研究
  • 学术资讯
  • Suppr Zotero 插件Zotero 插件
  • 邀请有礼
  • 套餐&价格
  • 历史记录
应用&插件
Suppr Zotero 插件Zotero 插件浏览器插件Mac 客户端Windows 客户端微信小程序
定价
高级版会员购买积分包购买API积分包
服务
文献检索文档翻译深度研究API 文档MCP 服务
关于我们
关于 Suppr公司介绍联系我们用户协议隐私条款
关注我们

Suppr 超能文献

核心技术专利:CN118964589B侵权必究
粤ICP备2023148730 号-1Suppr @ 2026

文献检索

告别复杂PubMed语法,用中文像聊天一样搜索,搜遍4000万医学文献。AI智能推荐,让科研检索更轻松。

立即免费搜索

文件翻译

保留排版,准确专业,支持PDF/Word/PPT等文件格式,支持 12+语言互译。

免费翻译文档

深度研究

AI帮你快速写综述,25分钟生成高质量综述,智能提取关键信息,辅助科研写作。

立即免费体验

确定新冠病毒传播状况和趋势的新型指标:建模研究

Novel Indicator to Ascertain the Status and Trend of COVID-19 Spread: Modeling Study.

作者信息

Nakano Takashi, Ikeda Yoichi

机构信息

Research Center for Nuclear Physics, Osaka University, Osaka, Japan.

Department of Physics, Faculty of Science, Kyushu University, Fukuoka, Japan.

出版信息

J Med Internet Res. 2020 Nov 30;22(11):e20144. doi: 10.2196/20144.

DOI:10.2196/20144
PMID:33180742
原文链接:https://pmc.ncbi.nlm.nih.gov/articles/PMC7708296/
Abstract

BACKGROUND

In the fight against the pandemic of COVID-19, it is important to ascertain the status and trend of the infection spread quickly and accurately.

OBJECTIVE

The purpose of our study is to formulate a new and simple indicator that represents the COVID-19 spread rate by using publicly available data.

METHODS

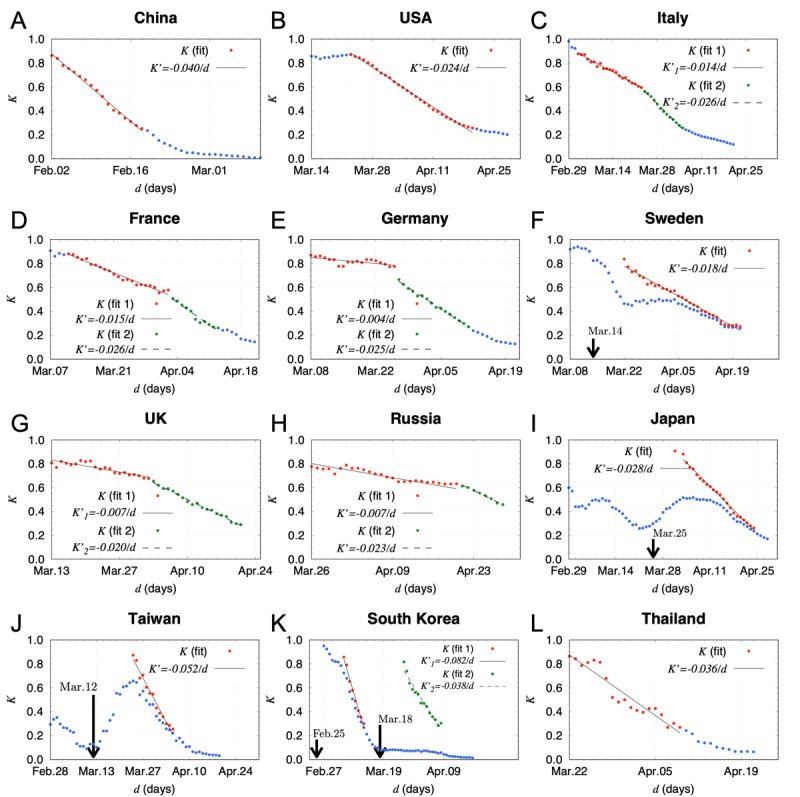
The new indicator K is a backward difference approximation of the logarithmic derivative of the cumulative number of cases with a time interval of 7 days. It is calculated as a ratio of the number of newly confirmed cases in a week to the total number of cases.

RESULTS

The analysis of the current status of COVID-19 spreading over countries showed an approximate linear decrease in the time evolution of the K value. The slope of the linear decrease differed from country to country. In addition, it was steeper for East and Southeast Asian countries than for European countries. The regional difference in the slope seems to reflect both social and immunological circumstances for each country.

CONCLUSIONS

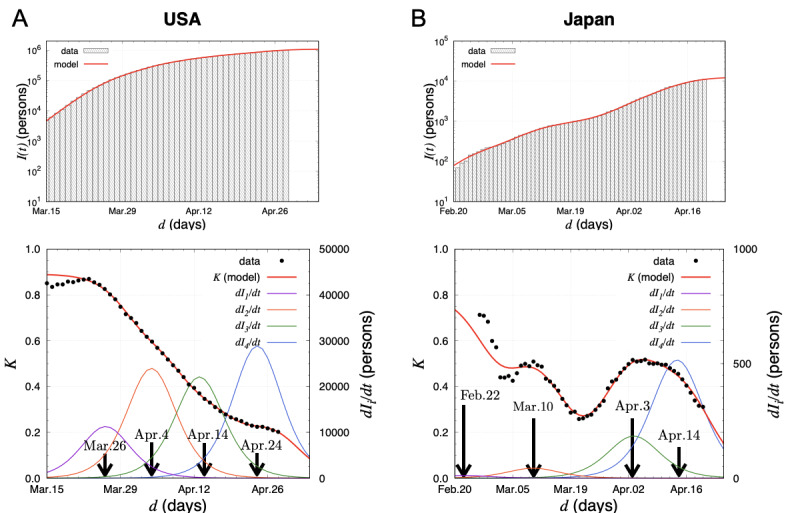
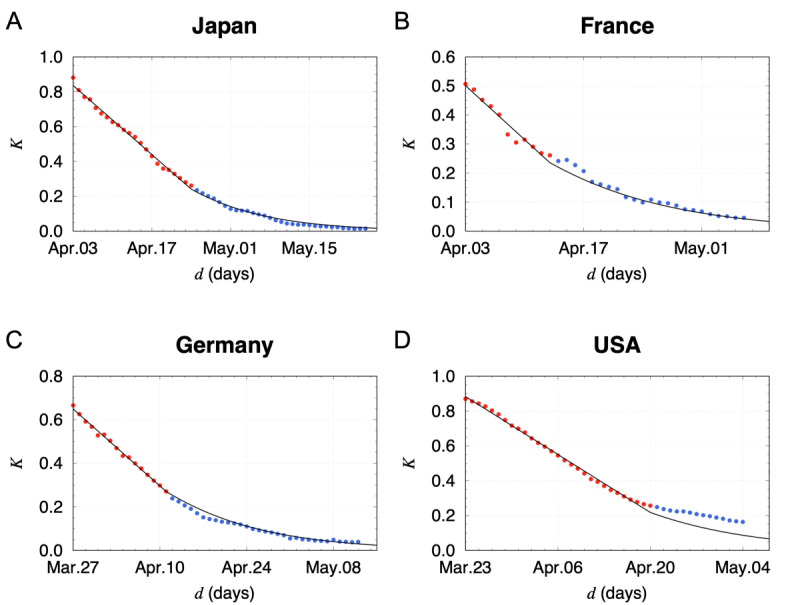
The approximate linear decrease of the K value indicates that the COVID-19 spread does not grow exponentially but starts to attenuate from the early stage. The K trajectory in a wide range was successfully reproduced by a phenomenological model with the constant attenuation assumption, indicating that the total number of the infected people follows the Gompertz curve. Focusing on the change in the value of K will help to improve and refine epidemiological models of COVID-19.

摘要

背景

在抗击新冠疫情的斗争中,快速准确地确定感染传播的状况和趋势至关重要。

目的

我们研究的目的是利用公开数据制定一个新的、简单的指标来代表新冠病毒的传播率。

方法

新指标K是累计病例数的对数导数在7天时间间隔下的后向差分近似值。它通过一周内新增确诊病例数与病例总数的比值来计算。

结果

对新冠病毒在各国传播现状的分析表明,K值的时间演变呈近似线性下降。线性下降的斜率因国家而异。此外,东亚和东南亚国家的斜率比欧洲国家更陡。斜率的区域差异似乎反映了每个国家的社会和免疫状况。

结论

K值的近似线性下降表明新冠病毒传播并非呈指数增长,而是从早期就开始减弱。通过具有恒定衰减假设的现象学模型成功再现了大范围的K轨迹,这表明感染人数总数遵循冈珀茨曲线。关注K值的变化将有助于改进和完善新冠病毒的流行病学模型。

https://cdn.ncbi.nlm.nih.gov/pmc/blobs/c710/7708296/0790b971db15/jmir_v22i11e20144_fig3.jpg
https://cdn.ncbi.nlm.nih.gov/pmc/blobs/c710/7708296/7d7e50e2f914/jmir_v22i11e20144_fig1.jpg
https://cdn.ncbi.nlm.nih.gov/pmc/blobs/c710/7708296/706e844457e7/jmir_v22i11e20144_fig2.jpg
https://cdn.ncbi.nlm.nih.gov/pmc/blobs/c710/7708296/0790b971db15/jmir_v22i11e20144_fig3.jpg
https://cdn.ncbi.nlm.nih.gov/pmc/blobs/c710/7708296/7d7e50e2f914/jmir_v22i11e20144_fig1.jpg
https://cdn.ncbi.nlm.nih.gov/pmc/blobs/c710/7708296/706e844457e7/jmir_v22i11e20144_fig2.jpg
https://cdn.ncbi.nlm.nih.gov/pmc/blobs/c710/7708296/0790b971db15/jmir_v22i11e20144_fig3.jpg

相似文献

1
Novel Indicator to Ascertain the Status and Trend of COVID-19 Spread: Modeling Study.确定新冠病毒传播状况和趋势的新型指标:建模研究
J Med Internet Res. 2020 Nov 30;22(11):e20144. doi: 10.2196/20144.
2
COVID-19 Misinformation Spread in Eight Countries: Exponential Growth Modeling Study.COVID-19 错误信息在八个国家的传播:指数增长模型研究。
J Med Internet Res. 2020 Dec 15;22(12):e24425. doi: 10.2196/24425.
3
Scrutinizing the heterogeneous spreading of COVID-19 outbreak in large territorial countries.审视大型领土国家 COVID-19 疫情的异质传播。
Phys Biol. 2021 Feb 20;18(2):025002. doi: 10.1088/1478-3975/abd0dc.
4
Battling COVID-19 pandemic waves in six South-East Asian countries: A real-time consensus review.应对东南亚六个国家的新冠疫情浪潮:实时共识综述
Med J Malaysia. 2020 Nov;75(6):613-625.
5
A SARS-CoV-2 Surveillance System in Sub-Saharan Africa: Modeling Study for Persistence and Transmission to Inform Policy.撒哈拉以南非洲的新冠病毒监测系统:关于持续存在和传播以指导政策的建模研究
J Med Internet Res. 2020 Nov 19;22(11):e24248. doi: 10.2196/24248.
6
Does COVID-19 Spread Through Droplets Alone?新冠病毒仅通过飞沫传播吗?
Front Public Health. 2020 Apr 24;8:163. doi: 10.3389/fpubh.2020.00163. eCollection 2020.
7
COVID-19 Trend Estimation in the Elderly Italian Region of Sardinia.COVID-19 趋势在意大利撒丁岛老年人群中的估计。
Front Public Health. 2020 Apr 24;8:153. doi: 10.3389/fpubh.2020.00153. eCollection 2020.
8
What the data say about border closures and COVID spread.关于边境关闭与新冠病毒传播的数据说明了什么。
Nature. 2021 Jan;589(7841):185. doi: 10.1038/d41586-020-03605-6.
9
SARS-CoV-2 lineage B.6 was the major contributor to early pandemic transmission in Malaysia.新冠病毒变异株 B.6 是马来西亚早期大流行传播的主要贡献者。
PLoS Negl Trop Dis. 2020 Nov 30;14(11):e0008744. doi: 10.1371/journal.pntd.0008744. eCollection 2020 Nov.
10
Meet the scientists investigating the origins of the COVID pandemic.来认识一下那些正在调查新冠疫情起源的科学家们。
Nature. 2020 Dec;588(7837):208. doi: 10.1038/d41586-020-03402-1.

引用本文的文献

1
Predicting the Number of Consultations by Emergency Medical Teams During Disasters Using a Constant Attenuation Model: Analyzing the Data of 6 Disasters in Japan and Mozambique Between 2016-2020.使用恒定衰减模型预测灾害期间紧急医疗队的会诊次数:分析2016年至2020年日本和莫桑比克6次灾害的数据。
Arch Acad Emerg Med. 2025 Mar 10;13(1):e38. doi: 10.22037/aaemj.v13i1.2457. eCollection 2025.
2
Quantifying the Regional Disproportionality of COVID-19 Spread: Modeling Study.量化新冠病毒传播的区域不均衡性:建模研究
JMIR Form Res. 2025 Jan 3;9:e59230. doi: 10.2196/59230.
3
A New Compartment Model of COVID-19 Transmission: The Broken-Link Model.

本文引用的文献

1
The challenges of modeling and forecasting the spread of COVID-19.新冠病毒传播建模和预测面临的挑战。
Proc Natl Acad Sci U S A. 2020 Jul 21;117(29):16732-16738. doi: 10.1073/pnas.2006520117. Epub 2020 Jul 2.
2
Interactive Web-based Graphs of Coronavirus Disease 2019 Cases and Deaths per Population by Country.国家人口每例新型冠状病毒病 2019 病例和死亡人数的交互式网络图表。
Clin Infect Dis. 2020 Jul 28;71(15):902-903. doi: 10.1093/cid/ciaa500.
3
Why does Japan have so few cases of COVID-19?为什么日本的 COVID-19 病例如此之少?
一种新的 COVID-19 传播 compartment 模型:断裂链路模型。
Int J Environ Res Public Health. 2022 Jun 3;19(11):6864. doi: 10.3390/ijerph19116864.
4
Modelling Analysis of COVID-19 Transmission and the State of Emergency in Japan.COVID-19 传播与日本紧急状态的建模分析。
Int J Environ Res Public Health. 2021 Jun 26;18(13):6858. doi: 10.3390/ijerph18136858.
5
On the effectiveness of the search and find method to suppress spread of SARS-CoV-2.搜索与发现方法对抑制 SARS-CoV-2 传播有效性的研究。
Proc Jpn Acad Ser B Phys Biol Sci. 2021;97(1):22-49. doi: 10.2183/pjab.97.002.
EMBO Mol Med. 2020 May 8;12(5):e12481. doi: 10.15252/emmm.202012481. Epub 2020 Apr 28.
4
Effective containment explains subexponential growth in recent confirmed COVID-19 cases in China.有效的遏制解释了近期中国确诊 COVID-19 病例呈次指数级增长的原因。
Science. 2020 May 15;368(6492):742-746. doi: 10.1126/science.abb4557. Epub 2020 Apr 8.
5
Estimating epidemic exponential growth rate and basic reproduction number.估算疫情指数增长率和基本再生数。
Infect Dis Model. 2020 Jan 8;5:129-141. doi: 10.1016/j.idm.2019.12.009. eCollection 2020.
6
Mathematical models to characterize early epidemic growth: A review.用于描述早期疫情增长的数学模型:综述
Phys Life Rev. 2016 Sep;18:66-97. doi: 10.1016/j.plrev.2016.07.005. Epub 2016 Jul 11.