• 文献检索
  • 文档翻译
  • 深度研究
  • 学术资讯
  • Suppr Zotero 插件Zotero 插件
  • 邀请有礼
  • 套餐&价格
  • 历史记录
应用&插件
Suppr Zotero 插件Zotero 插件浏览器插件Mac 客户端Windows 客户端微信小程序
定价
高级版会员购买积分包购买API积分包
服务
文献检索文档翻译深度研究API 文档MCP 服务
关于我们
关于 Suppr公司介绍联系我们用户协议隐私条款
关注我们

Suppr 超能文献

核心技术专利:CN118964589B侵权必究
粤ICP备2023148730 号-1Suppr @ 2026

文献检索

告别复杂PubMed语法,用中文像聊天一样搜索,搜遍4000万医学文献。AI智能推荐,让科研检索更轻松。

立即免费搜索

文件翻译

保留排版,准确专业,支持PDF/Word/PPT等文件格式,支持 12+语言互译。

免费翻译文档

深度研究

AI帮你快速写综述,25分钟生成高质量综述,智能提取关键信息,辅助科研写作。

立即免费体验

CovidCounties 是一个交互式实时追踪器,用于追踪美国各县的 COVID19 大流行情况。

CovidCounties is an interactive real time tracker of the COVID19 pandemic at the level of US counties.

机构信息

Bakar Computational Health Sciences Institute, University of California, San Francisco, San Francisco, CA, USA.

School of Medicine, University of California, San Francisco, San Francisco, CA, USA.

出版信息

Sci Data. 2020 Nov 16;7(1):405. doi: 10.1038/s41597-020-00731-8.

DOI:10.1038/s41597-020-00731-8
PMID:33199721
原文链接:https://pmc.ncbi.nlm.nih.gov/articles/PMC7669883/
Abstract

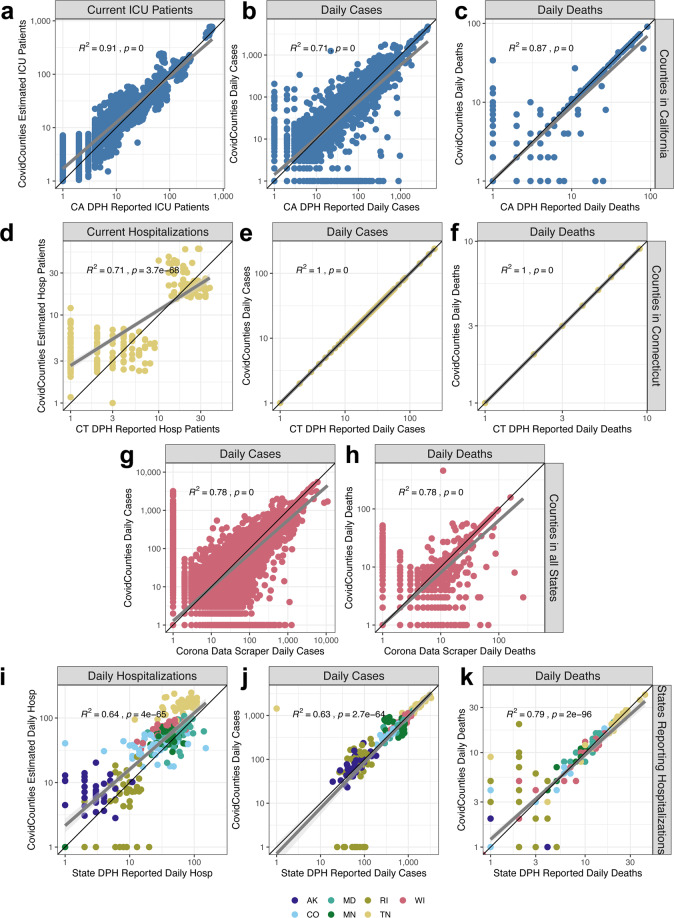
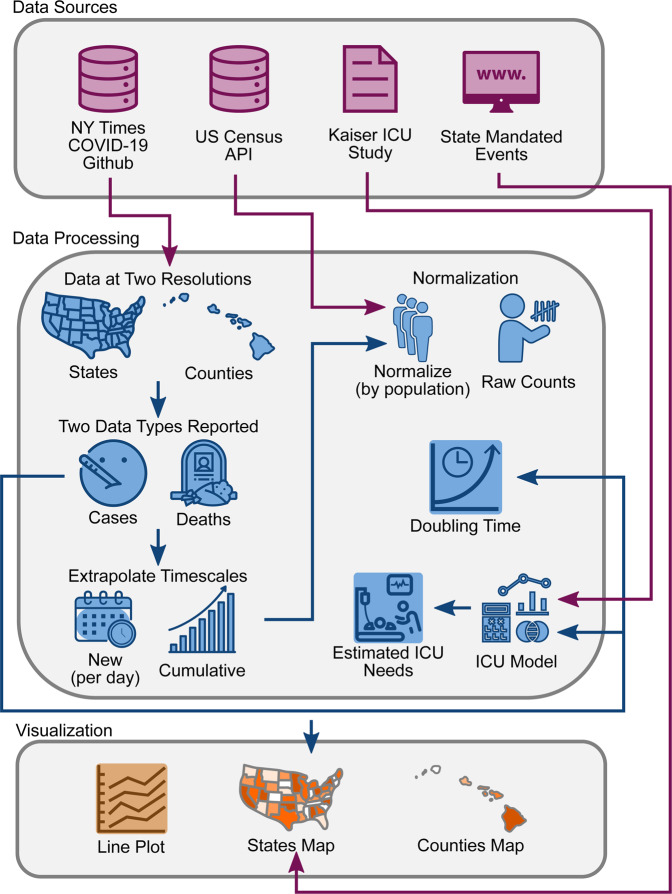
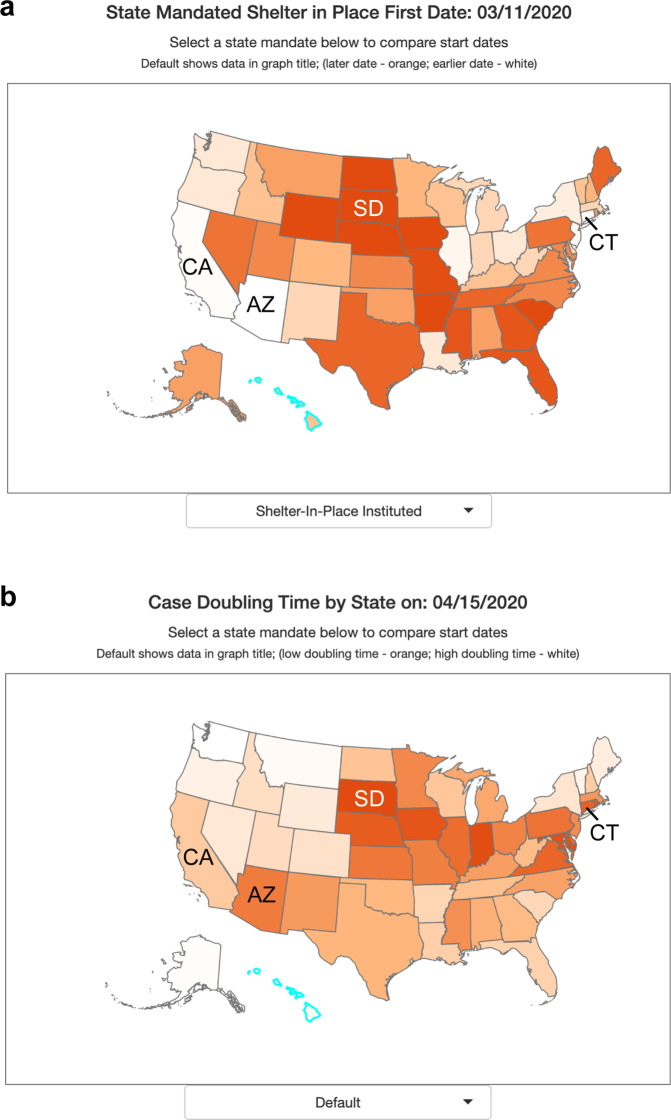
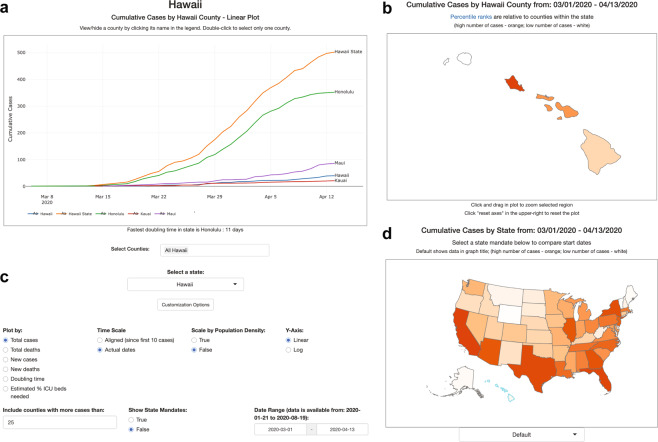
Management of the COVID-19 pandemic has proven to be a significant challenge to policy makers. This is in large part due to uneven reporting and the absence of open-access visualization tools to present local trends and infer healthcare needs. Here we report the development of CovidCounties.org, an interactive web application that depicts daily disease trends at the level of US counties using time series plots and maps. This application is accompanied by a manually curated dataset that catalogs all major public policy actions made at the state-level, as well as technical validation of the primary data. Finally, the underlying code for the site is also provided as open source, enabling others to validate and learn from this work.

摘要

管理 COVID-19 大流行已被证明是政策制定者面临的重大挑战。这在很大程度上是由于报告不均衡以及缺乏开放获取的可视化工具来展示当地趋势并推断医疗保健需求。在这里,我们报告了 CovidCounties.org 的开发,这是一个交互式网络应用程序,使用时间序列图和地图来描述美国县级的每日疾病趋势。该应用程序附有一个手动策划的数据集,该数据集记录了州一级的所有主要公共政策行动,以及对主要数据的技术验证。最后,还提供了该网站的基础代码作为开源,使其他人能够验证和从这项工作中学习。

https://cdn.ncbi.nlm.nih.gov/pmc/blobs/26fa/7669883/3a8dab7e20ed/41597_2020_731_Fig4_HTML.jpg
https://cdn.ncbi.nlm.nih.gov/pmc/blobs/26fa/7669883/5b18f4043796/41597_2020_731_Fig1_HTML.jpg
https://cdn.ncbi.nlm.nih.gov/pmc/blobs/26fa/7669883/b98107e4d135/41597_2020_731_Fig2_HTML.jpg
https://cdn.ncbi.nlm.nih.gov/pmc/blobs/26fa/7669883/7bacda0f00ca/41597_2020_731_Fig3_HTML.jpg
https://cdn.ncbi.nlm.nih.gov/pmc/blobs/26fa/7669883/3a8dab7e20ed/41597_2020_731_Fig4_HTML.jpg

相似文献

1
CovidCounties is an interactive real time tracker of the COVID19 pandemic at the level of US counties.CovidCounties 是一个交互式实时追踪器,用于追踪美国各县的 COVID19 大流行情况。
Sci Data. 2020 Nov 16;7(1):405. doi: 10.1038/s41597-020-00731-8.
2
CovidCounties - an interactive, real-time tracker of the COVID-19 pandemic at the level of US counties.新冠疫情美国各县数据追踪器——一款针对美国各县新冠疫情的交互式实时追踪工具。
medRxiv. 2020 May 2:2020.04.28.20083279. doi: 10.1101/2020.04.28.20083279.
3
Complex Reporting of the COVID-19 Epidemic in the Czech Republic: Use of an Interactive Web-Based App in Practice.捷克共和国COVID-19疫情的复杂报告:交互式网络应用程序在实际中的应用。
J Med Internet Res. 2020 May 27;22(5):e19367. doi: 10.2196/19367.
4
An interactive online dashboard for tracking COVID-19 in U.S. counties, cities, and states in real time.一个交互式在线仪表板,用于实时跟踪美国各县、市和州的 COVID-19 疫情。
J Am Med Inform Assoc. 2020 Jul 1;27(7):1121-1125. doi: 10.1093/jamia/ocaa071.
5
The COVID-19 Pandemic-Can open access modeling give us better answers more quickly?新冠疫情——开放获取模型能更快地为我们提供更好的答案吗?
J Appl Clin Med Phys. 2020 Jun;21(6):4-6. doi: 10.1002/acm2.12941. Epub 2020 Jun 1.
6
Association of Social Distancing, Population Density, and Temperature With the Instantaneous Reproduction Number of SARS-CoV-2 in Counties Across the United States.社交距离、人口密度和温度与美国各县 SARS-CoV-2 瞬时繁殖数的关系。
JAMA Netw Open. 2020 Jul 1;3(7):e2016099. doi: 10.1001/jamanetworkopen.2020.16099.
7
Association between mobility patterns and COVID-19 transmission in the USA: a mathematical modelling study.美国移动模式与 COVID-19 传播的关联:一项数学建模研究。
Lancet Infect Dis. 2020 Nov;20(11):1247-1254. doi: 10.1016/S1473-3099(20)30553-3. Epub 2020 Jul 1.
8
The current COVID19 (SARS-2 COV-19) pandemic: A lesson for all.当前的新冠疫情(严重急性呼吸综合征冠状病毒2型,即SARS-CoV-2所致):给所有人的一个教训。
J Pak Med Assoc. 2020 Jul;70(7):1115-1116.
9
The COronavirus Pandemic Epidemiology (COPE) Consortium: A Call to Action.《冠状病毒大流行的流行病学(COPE)联盟:行动呼吁》。
Cancer Epidemiol Biomarkers Prev. 2020 Jul;29(7):1283-1289. doi: 10.1158/1055-9965.EPI-20-0606. Epub 2020 May 5.
10
COVID19-world: a shiny application to perform comprehensive country-specific data visualization for SARS-CoV-2 epidemic.COVID19 世界:一个闪亮的应用程序,用于对 SARS-CoV-2 疫情进行全面的特定国家数据可视化。
BMC Med Res Methodol. 2020 Sep 21;20(1):235. doi: 10.1186/s12874-020-01121-9.

引用本文的文献

1
Capturing the COVID-19 Crisis through Public Health and Social Measures Data Science.通过公共卫生和社会措施数据科学捕捉 COVID-19 危机
Sci Data. 2022 Aug 26;9(1):520. doi: 10.1038/s41597-022-01616-8.
2
Information Flow and Data Gaps in COVID-19 Recording and Reporting at National and Provincial Levels in Indonesia.印度尼西亚国家和省级层面新冠疫情记录与报告中的信息流及数据缺口
Healthcare (Basel). 2022 Jan 20;10(2):204. doi: 10.3390/healthcare10020204.
3
The Clinical Information Systems Response to the COVID-19 Pandemic.临床信息系统应对 COVID-19 大流行的措施。

本文引用的文献

1
Ascertainment rate of novel coronavirus disease (COVID-19) in Japan.日本新型冠状病毒病(COVID-19)的检出率。
Int J Infect Dis. 2020 Jul;96:673-675. doi: 10.1016/j.ijid.2020.04.080. Epub 2020 May 8.
2
Commentary on Ferguson, et al., "Impact of Non-pharmaceutical Interventions (NPIs) to Reduce COVID-19 Mortality and Healthcare Demand".评 Ferguson 等人的“减少 COVID-19 死亡率和医疗需求的非药物干预(NPIs)的影响”一文。
Bull Math Biol. 2020 Apr 8;82(4):52. doi: 10.1007/s11538-020-00726-x.
3
Epidemiological data from the COVID-19 outbreak, real-time case information.
Yearb Med Inform. 2021 Aug;30(1):105-125. doi: 10.1055/s-0041-1726513. Epub 2021 Sep 3.
4
Welcome to the revolution: COVID-19 and the democratization of spatial-temporal data.欢迎来到这场变革:新冠疫情与时空数据的民主化。
Patterns (N Y). 2021 May 6;2(7):100272. doi: 10.1016/j.patter.2021.100272. eCollection 2021 Jul 9.
5
Flow Immersive: A Multiuser, Multidimensional, Multiplatform Interactive Covid-19 Data Visualization Tool.沉浸式流动:一种多用户、多维度、多平台的交互式新冠疫情数据可视化工具。
Front Psychol. 2021 May 13;12:661613. doi: 10.3389/fpsyg.2021.661613. eCollection 2021.
6
Dynamic Management of Lung Cancer Care During Surging COVID-19.新冠疫情激增期间肺癌护理的动态管理
Front Surg. 2021 Apr 7;8:663364. doi: 10.3389/fsurg.2021.663364. eCollection 2021.
7
Visualizing and assessing US county-level COVID19 vulnerability.可视化和评估美国县级 COVID19 脆弱性。
Am J Infect Control. 2021 Jun;49(6):678-684. doi: 10.1016/j.ajic.2020.12.009. Epub 2020 Dec 19.
新冠疫情流行病学数据,实时病例信息。
Sci Data. 2020 Mar 24;7(1):106. doi: 10.1038/s41597-020-0448-0.
4
An interactive web-based dashboard to track COVID-19 in real time.一个基于网络的交互式仪表盘,用于实时追踪新冠病毒。
Lancet Infect Dis. 2020 May;20(5):533-534. doi: 10.1016/S1473-3099(20)30120-1. Epub 2020 Feb 19.