Department of Pediatrics, Children's Hospital of Philadelphia, Philadelphia, Pennsylvania.
Department of Pediatrics, Perelman School of Medicine at the University of Pennsylvania, Philadelphia.
JAMA Netw Open. 2020 Jul 1;3(7):e2016099. doi: 10.1001/jamanetworkopen.2020.16099.
Local variation in the transmission of severe acute respiratory syndrome coronavirus 2 (SARS-CoV-2) across the United States has not been well studied.
To examine the association of county-level factors with variation in the SARS-CoV-2 reproduction number over time.
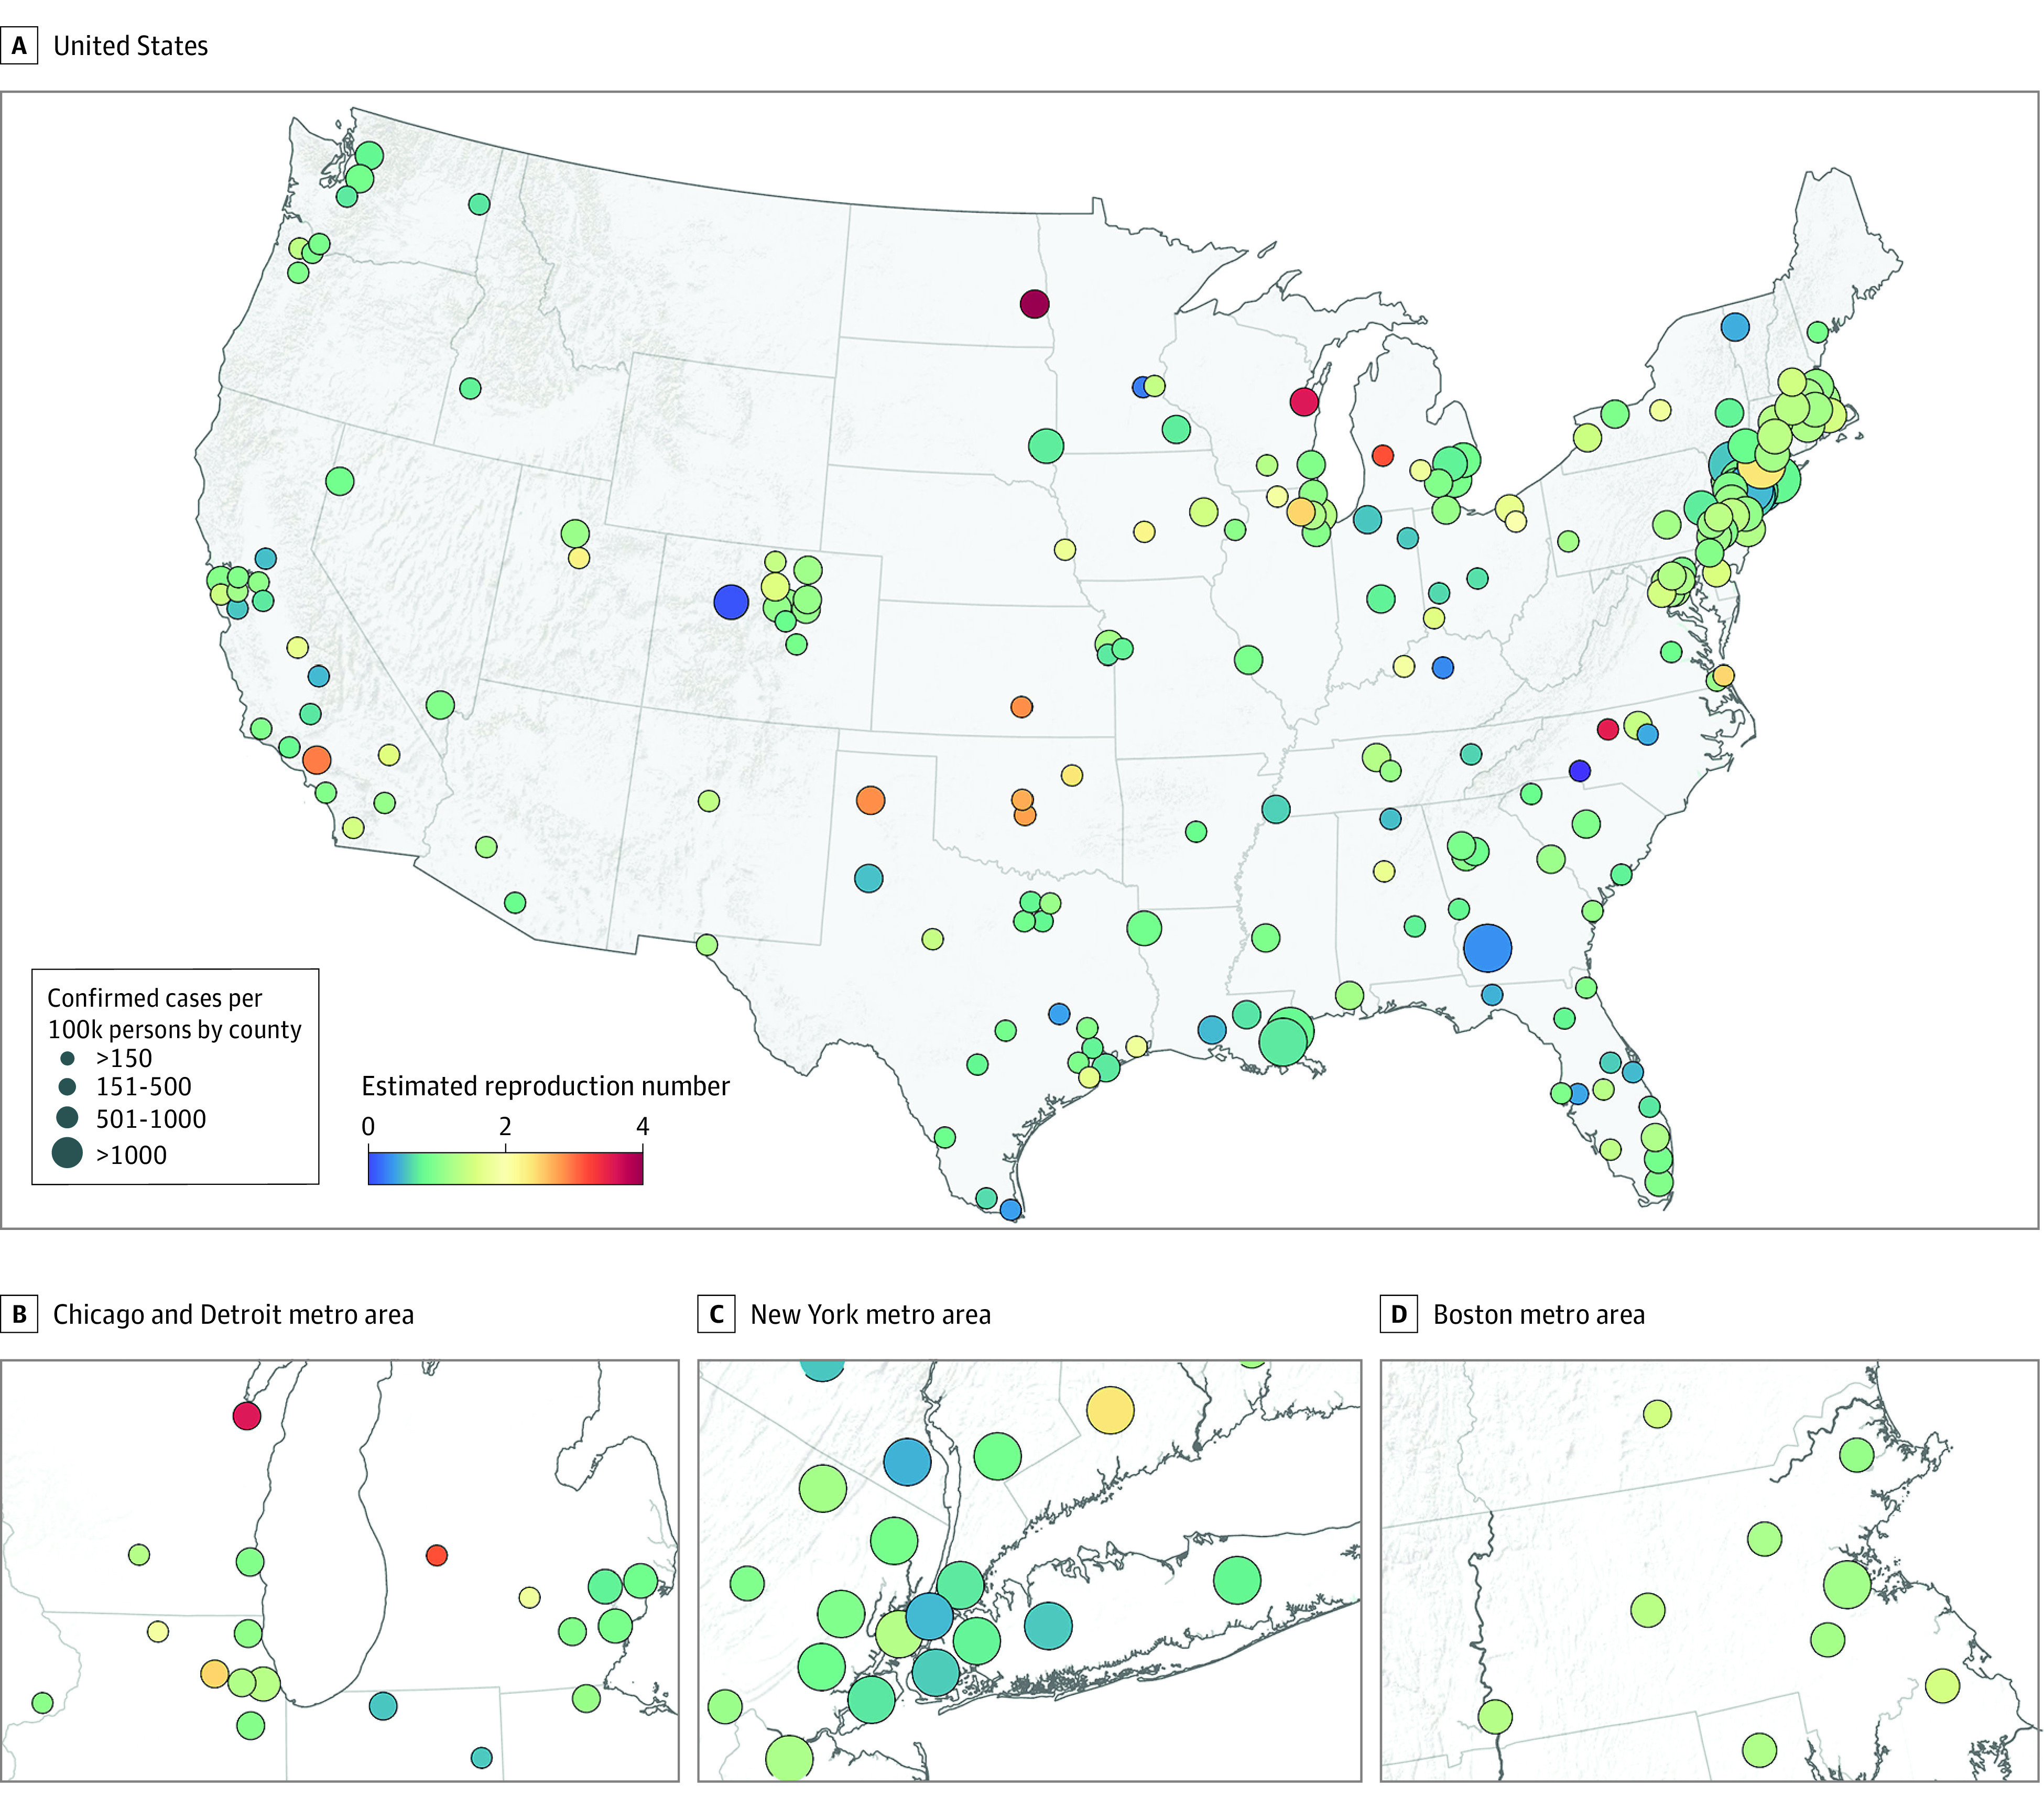
DESIGN, SETTING, AND PARTICIPANTS: This cohort study included 211 counties, representing state capitals and cities with at least 100 000 residents and including 178 892 208 US residents, in 46 states and the District of Columbia between February 25, 2020, and April 23, 2020.
Social distancing, measured by percentage change in visits to nonessential businesses; population density; and daily wet-bulb temperatures.
Instantaneous reproduction number (Rt), or cases generated by each incident case at a given time, estimated from daily case incidence data.
The 211 counties contained 178 892 208 of 326 289 971 US residents (54.8%). Median (interquartile range) population density was 1022.7 (471.2-1846.0) people per square mile. The mean (SD) peak reduction in visits to nonessential business between April 6 and April 19, as the country was sheltering in place, was 68.7% (7.9%). Median (interquartile range) daily wet-bulb temperatures were 7.5 (3.8-12.8) °C. Median (interquartile range) case incidence and fatality rates per 100 000 people were approximately 10 times higher for the top decile of densely populated counties (1185.2 [313.2-1891.2] cases; 43.7 [10.4-106.7] deaths) than for counties in the lowest density quartile (121.4 [87.8-175.4] cases; 4.2 [1.9-8.0] deaths). Mean (SD) Rt in the first 2 weeks was 5.7 (2.5) in the top decile compared with 3.1 (1.2) in the lowest quartile. In multivariable analysis, a 50% decrease in visits to nonessential businesses was associated with a 45% decrease in Rt (95% CI, 43%-49%). From a relative Rt at 0 °C of 2.13 (95% CI, 1.89-2.40), relative Rt decreased to a minimum as temperatures warmed to 11 °C, increased between 11 and 20 °C (1.61; 95% CI, 1.42-1.84) and then declined again at temperatures greater than 20 °C. With a 70% reduction in visits to nonessential business, 202 counties (95.7%) were estimated to fall below a threshold Rt of 1.0, including 17 of 21 counties (81.0%) in the top density decile and 52 of 53 counties (98.1%) in the lowest density quartile.2.
In this cohort study, social distancing, lower population density, and temperate weather were associated with a decreased Rt for SARS-CoV-2 in counties across the United States. These associations could inform selective public policy planning in communities during the coronavirus disease 2019 pandemic.
美国各地严重急性呼吸系统综合症冠状病毒 2 (SARS-CoV-2)的传播存在局部差异,但这方面的研究还不够充分。
研究县级因素与 SARS-CoV-2 繁殖数随时间变化的关系。
设计、地点和参与者:本队列研究纳入了 211 个县,这些县代表了拥有至少 100 万居民的州首府和城市,包括 46 个州和哥伦比亚特区的 178892208 名美国居民,研究时间为 2020 年 2 月 25 日至 2020 年 4 月 23 日。
通过非必要企业访问量的百分比变化来衡量社会隔离程度;人口密度;以及每日湿球温度。
即时繁殖数(Rt),即在给定时间内每个发病病例产生的病例数,通过每日发病数据估计。
这 211 个县包含了 326289971 名美国居民中的 178892208 人(54.8%)。中位数(四分位距)人口密度为 1022.7(471.2-1846.0)人/平方英里。4 月 6 日至 19 日,全国实行就地避难措施时,非必要企业访问量的平均(SD)峰值降幅为 68.7%(7.9%)。中位数(四分位距)每日湿球温度为 7.5(3.8-12.8)℃。中位数(四分位距)每 10 万人的病例发生率和死亡率,在人口密度最高的十分位数县(1185.2[313.2-1891.2]例;43.7[10.4-106.7]例死亡)是人口密度最低的四分之一县(121.4[87.8-175.4]例;4.2[1.9-8.0]例死亡)的约 10 倍。在最初的 2 周内,Rt 的平均值(SD)在十分位数最高的县为 5.7(2.5),而在四分位数最低的县为 3.1(1.2)。在多变量分析中,非必要企业访问量减少 50%与 Rt 减少 45%相关(95%CI,43%-49%)。从相对 Rt 在 0°C时的 2.13(95%CI,1.89-2.40)开始,随着温度升高到 11°C,相对 Rt 逐渐减小,在 11 到 20°C之间(1.61;95%CI,1.42-1.84),然后在温度大于 20°C时再次下降。如果非必要企业的访问量减少 70%,则估计有 202 个县(95.7%)的 Rt 低于 1.0 的阈值,其中包括 21 个县中的 17 个(81.0%)和 53 个县中的 52 个(98.1%)在人口密度最高的十分位数。2.
在这项队列研究中,社会隔离、较低的人口密度和温和的天气与美国各县 SARS-CoV-2 的 Rt 降低有关。这些关联可以为 2019 年冠状病毒病大流行期间社区有选择性的公共政策规划提供信息。