• 文献检索
  • 文档翻译
  • 深度研究
  • 学术资讯
  • Suppr Zotero 插件Zotero 插件
  • 邀请有礼
  • 套餐&价格
  • 历史记录
应用&插件
Suppr Zotero 插件Zotero 插件浏览器插件Mac 客户端Windows 客户端微信小程序
定价
高级版会员购买积分包购买API积分包
服务
文献检索文档翻译深度研究API 文档MCP 服务
关于我们
关于 Suppr公司介绍联系我们用户协议隐私条款
关注我们

Suppr 超能文献

核心技术专利:CN118964589B侵权必究
粤ICP备2023148730 号-1Suppr @ 2026

文献检索

告别复杂PubMed语法,用中文像聊天一样搜索,搜遍4000万医学文献。AI智能推荐,让科研检索更轻松。

立即免费搜索

文件翻译

保留排版,准确专业,支持PDF/Word/PPT等文件格式,支持 12+语言互译。

免费翻译文档

深度研究

AI帮你快速写综述,25分钟生成高质量综述,智能提取关键信息,辅助科研写作。

立即免费体验

2003 - 2017年期间,MODIS反演数据和CAM5模拟结果揭示的主要大陆外流区域燃烧气溶胶和沙尘的年际变率及趋势

Interannual variability and trends of combustion aerosol and dust in major continental outflows revealed by MODIS retrievals and CAM5 simulations during 2003-2017.

作者信息

Yu Hongbin, Yang Yang, Wang Hailong, Tan Qian, Chin Mian, Levy Robert C, Remer Lorraine A, Smith Steven J, Yuan Tianle, Shi Yingxi

机构信息

Earth Sciences Division, NASA Goddard Space Flight Center, Greenbelt, MD, USA.

Pacific Northwest National Laboratory, Richland, WA, USA.

出版信息

Atmos Chem Phys. 2020 Jan;20(1):139-161. doi: 10.5194/acp-20-139-2020. Epub 2020 Jan 3.

DOI:10.5194/acp-20-139-2020
PMID:33204243
原文链接:https://pmc.ncbi.nlm.nih.gov/articles/PMC7668156/
Abstract

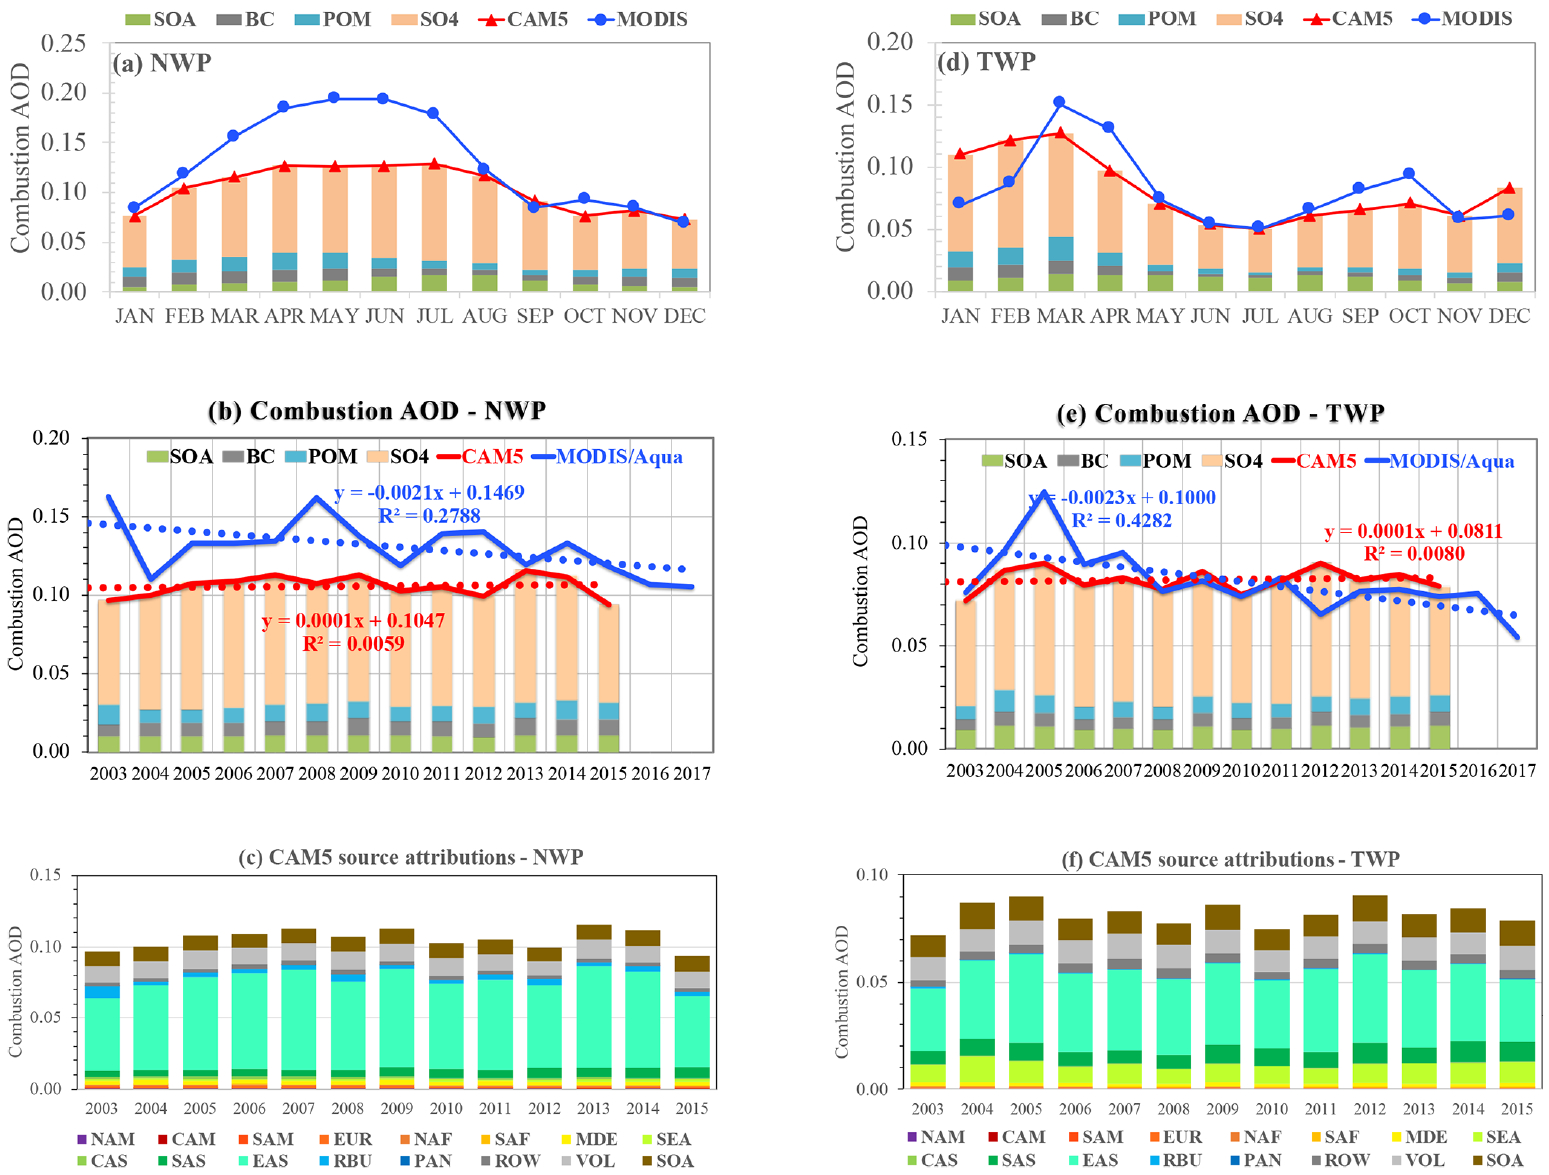
Emissions and long-range transport of mineral dust and combustion-related aerosol from burning fossil fuels and biomass vary from year to year, driven by the evolution of the economy and changes in meteorological conditions and environmental regulations. This study offers both satellite and model perspectives on the interannual variability and possible trends of combustion aerosol and dust in major continental outflow regions over the past 15 years (2003-2017). The decade-long record of aerosol optical depth (AOD, denoted as ), separately for combustion aerosol ( ) and dust ( ), over global oceans is derived from the Collection 6 aerosol products of the Moderate Resolution Imaging Spectroradiometer (MODIS) onboard both Terra and Aqua. These MODIS Aqua datasets, complemented by aerosol source-tagged simulations using the Community Atmospheric Model version 5 (CAM5), are then analyzed to understand the interannual variability and potential trends of and in the major continental outflows. Both MODIS and CAM5 consistently yield a similar decreasing trend of -0.017 to -0.020 per decade for over the North Atlantic Ocean and the Mediterranean Sea that is attributable to reduced emissions from North America and Europe, respectively. On the contrary, both MODIS and CAM5 display an increasing trend of +0.017 to +0.036 per decade for over the tropical Indian Ocean, the Bay of Bengal, and the Arabian Sea, which reflects the influence of increased anthropogenic emissions from South Asia and the Middle East in the last 2 decades. Over the northwestern Pacific Ocean, which is often affected by East Asian emissions of pollution and dust, the MODIS retrievals show a decreasing trend of -0.021 per decade for and -0.012 per decade for , which is, however, not reproduced by the CAM5 model. In other outflow regions strongly influenced by biomass burning smoke or dust, both MODIS retrievals and CAM5 simulations show no statistically significant trends; the MODIS-observed interannual variability is usually larger than that of the CAM5 simulation.

摘要

燃烧化石燃料和生物质所产生的矿物尘埃以及与燃烧相关的气溶胶的排放和远距离传输,会因经济发展、气象条件变化以及环境法规的演变而逐年变化。本研究从卫星和模型两个角度,探讨了过去15年(2003 - 2017年)主要大陆外流区域燃烧气溶胶和尘埃的年际变化及可能趋势。全球海洋上长达十年的气溶胶光学厚度(AOD,记为 )记录,分别针对燃烧气溶胶( )和尘埃( ),源自搭载在Terra和Aqua卫星上的中分辨率成像光谱仪(MODIS)的第6版气溶胶产品。然后,结合使用社区大气模型第5版(CAM5)进行的气溶胶源标记模拟,对这些MODIS Aqua数据集进行分析,以了解主要大陆外流区域 和 的年际变化及潜在趋势。MODIS和CAM5均一致显示,在北大西洋和地中海, 每十年呈现出 -0.017至 -0.020的下降趋势,这分别归因于北美和欧洲排放量的减少。相反,在热带印度洋、孟加拉湾和阿拉伯海,MODIS和CAM5均显示 每十年呈现出 +0.017至 +0.036的上升趋势,这反映了过去20年南亚和中东人为排放量增加的影响。在经常受到东亚污染和尘埃排放影响的西北太平洋,MODIS反演结果显示 每十年下降趋势为 -0.021, 为 -0.012,然而,CAM5模型并未再现这一结果。在其他受生物质燃烧烟雾或尘埃强烈影响的外流区域,MODIS反演结果和CAM5模拟均未显示出具有统计学意义的趋势;MODIS观测到的年际变化通常大于CAM5模拟结果。

https://cdn.ncbi.nlm.nih.gov/pmc/blobs/e8df/7668156/aeb8811da097/nihms-1643830-f0013.jpg
https://cdn.ncbi.nlm.nih.gov/pmc/blobs/e8df/7668156/53290fc35061/nihms-1643830-f0001.jpg
https://cdn.ncbi.nlm.nih.gov/pmc/blobs/e8df/7668156/0df89e3ee269/nihms-1643830-f0002.jpg
https://cdn.ncbi.nlm.nih.gov/pmc/blobs/e8df/7668156/715f18063ffa/nihms-1643830-f0003.jpg
https://cdn.ncbi.nlm.nih.gov/pmc/blobs/e8df/7668156/eb1cfe2872a8/nihms-1643830-f0004.jpg
https://cdn.ncbi.nlm.nih.gov/pmc/blobs/e8df/7668156/f4f0f6ae7c90/nihms-1643830-f0005.jpg
https://cdn.ncbi.nlm.nih.gov/pmc/blobs/e8df/7668156/cd0b0123d606/nihms-1643830-f0006.jpg
https://cdn.ncbi.nlm.nih.gov/pmc/blobs/e8df/7668156/5bcefa75cb76/nihms-1643830-f0007.jpg
https://cdn.ncbi.nlm.nih.gov/pmc/blobs/e8df/7668156/a9ca1f3f2057/nihms-1643830-f0008.jpg
https://cdn.ncbi.nlm.nih.gov/pmc/blobs/e8df/7668156/051cd3d8d849/nihms-1643830-f0009.jpg
https://cdn.ncbi.nlm.nih.gov/pmc/blobs/e8df/7668156/6d56f23bd938/nihms-1643830-f0010.jpg
https://cdn.ncbi.nlm.nih.gov/pmc/blobs/e8df/7668156/33400f71785b/nihms-1643830-f0011.jpg
https://cdn.ncbi.nlm.nih.gov/pmc/blobs/e8df/7668156/54c33fa766fe/nihms-1643830-f0012.jpg
https://cdn.ncbi.nlm.nih.gov/pmc/blobs/e8df/7668156/aeb8811da097/nihms-1643830-f0013.jpg

相似文献

1
Interannual variability and trends of combustion aerosol and dust in major continental outflows revealed by MODIS retrievals and CAM5 simulations during 2003-2017.2003 - 2017年期间,MODIS反演数据和CAM5模拟结果揭示的主要大陆外流区域燃烧气溶胶和沙尘的年际变率及趋势
Atmos Chem Phys. 2020 Jan;20(1):139-161. doi: 10.5194/acp-20-139-2020. Epub 2020 Jan 3.
2
Exploring systematic offsets between aerosol products from the two MODIS sensors.探索来自两颗MODIS传感器的气溶胶产品之间的系统偏差。
Atmos Meas Tech. 2018 Jul;11(7):4073-4092. doi: 10.5194/amt-11-4073-2018. Epub 2018 Jul 13.
3
Climatological trends in satellite-derived aerosol optical depth over North India and its relationship with crop residue burning: Rural-urban contrast.卫星-derived 气溶胶光学厚度在印度北部的气候趋势及其与农作物秸秆燃烧的关系:城乡对比。
Sci Total Environ. 2020 Dec 15;748:140963. doi: 10.1016/j.scitotenv.2020.140963. Epub 2020 Jul 21.
4
Aerosol-induced atmospheric heating rate decreases over South and East Asia as a result of changing content and composition.气溶胶引起的大气加热率在南亚和东亚减少,这是由于含量和成分的变化。
Sci Rep. 2020 Nov 18;10(1):20091. doi: 10.1038/s41598-020-76936-z.
5
A 20-year simulated climatology of global dust aerosol deposition.全球尘气溶胶沉积的 20 年模拟气候学。
Sci Total Environ. 2016 Jul 1;557-558:861-8. doi: 10.1016/j.scitotenv.2016.03.086. Epub 2016 Apr 17.
6
Satellite-based view of the aerosol spatial and temporal variability in the Córdoba region (Argentina) using over ten years of high-resolution data.利用十多年的高分辨率数据,对科尔多瓦地区(阿根廷)气溶胶的时空变化进行基于卫星的观测。
ISPRS J Photogramm Remote Sens. 2018 Nov;145:250-267. doi: 10.1016/j.isprsjprs.2018.08.016. Epub 2018 Sep 26.
7
Seasonal, interannual, and long-term variabilities in biomass burning activity over South Asia.南亚生物质燃烧活动的季节性、年际和长期变化。
Environ Sci Pollut Res Int. 2016 Mar;23(5):4397-410. doi: 10.1007/s11356-015-5629-6. Epub 2015 Oct 27.
8
Spatio-temporal correspondence of aerosol optical depth between CMIP6 simulations and MODIS retrievals over India.CMIP6模拟与印度地区MODIS反演的气溶胶光学厚度的时空对应关系。
Environ Sci Pollut Res Int. 2024 Mar;31(11):16899-16914. doi: 10.1007/s11356-024-32314-0. Epub 2024 Feb 8.
9
Spatiotemporal variability and contribution of different aerosol types to the Aerosol Optical Depth over the Eastern Mediterranean.地中海东部不同气溶胶类型对气溶胶光学厚度的时空变化及贡献
Atmos Chem Phys. 2016;16(21):13853-13884. doi: 10.5194/acp-16-13853-2016. Epub 2016 Nov 9.
10
Evaluation and Comparison of Multi-Satellite Aerosol Optical Depth Products over East Asia Ocean.东亚海域多卫星气溶胶光学厚度产品的评估与比较
Toxics. 2023 Sep 26;11(10):813. doi: 10.3390/toxics11100813.

引用本文的文献

1
North Atlantic and the Barents Sea variability contribute to the 2023 extreme fire season in Canada.北大西洋和巴伦支海的变化导致了2023年加拿大的极端火灾季节。
Proc Natl Acad Sci U S A. 2024 Dec 3;121(49):e2414241121. doi: 10.1073/pnas.2414241121. Epub 2024 Nov 18.
2
Drivers of recent decline in dust activity over East Asia.东亚近期沙尘活动减弱的驱动因素。
Nat Commun. 2022 Nov 19;13(1):7105. doi: 10.1038/s41467-022-34823-3.
3
Aerosol responses to precipitation along North American air trajectories arriving at Bermuda.沿抵达百慕大的北美空气轨迹的降水的气溶胶响应。

本文引用的文献

1
Positive Low Cloud and Dust Feedbacks Amplify Tropical North Atlantic Multidecadal Oscillation.正的低空云层和沙尘反馈增强了热带北大西洋多年代际振荡。
Geophys Res Lett. 2016 Feb 16;43(3):1349-1356. doi: 10.1002/2016GL067679. Epub 2016 Jan 16.
2
Exploring systematic offsets between aerosol products from the two MODIS sensors.探索来自两颗MODIS传感器的气溶胶产品之间的系统偏差。
Atmos Meas Tech. 2018 Jul;11(7):4073-4092. doi: 10.5194/amt-11-4073-2018. Epub 2018 Jul 13.
3
Estimates of African Dust Deposition Along the Trans-Atlantic Transit Using the Decade-long Record of Aerosol Measurements from CALIOP, MODIS, MISR, and IASI.
Atmos Chem Phys. 2021 Nov 2;21(21):16121-16141. doi: 10.5194/acp-21-16121-2021.
4
An Overview of Atmospheric Features Over the Western North Atlantic Ocean and North American East Coast - Part 1: Analysis of Aerosols, Gases, and Wet Deposition Chemistry.北大西洋西部和北美东海岸大气特征概述——第1部分:气溶胶、气体和湿沉降化学分析
J Geophys Res Atmos. 2021 Feb 27;126(4). doi: 10.1029/2020jd032592. Epub 2021 Jan 11.
5
Harmonized and high-quality datasets of aerosol optical depth at a US continental site, 1997-2018.1997 - 2018年美国大陆某站点气溶胶光学厚度的统一高质量数据集。
Sci Data. 2021 Mar 11;8(1):82. doi: 10.1038/s41597-021-00866-2.
利用CALIOP、MODIS、MISR和IASI长达十年的气溶胶测量记录估算跨大西洋运输过程中的非洲沙尘沉降量。
J Geophys Res Atmos. 2019 Jul 27;124(14):7975-7996. doi: 10.1029/2019JD030574. Epub 2019 Jul 12.
4
The Modern-Era Retrospective Analysis for Research and Applications, Version 2 (MERRA-2).现代时代研究与应用回顾分析第2版(MERRA-2)
J Clim. 2017 Jun 20;Volume 30(Iss 13):5419-5454. doi: 10.1175/JCLI-D-16-0758.1.
5
Temporal and spatial variations in sand and dust storm events in East Asia from 2007 to 2016: Relationships with surface conditions and climate change.2007 年至 2016 年东亚地区沙尘天气事件的时空变化:与地表状况和气候变化的关系。
Sci Total Environ. 2018 Aug 15;633:452-462. doi: 10.1016/j.scitotenv.2018.03.068. Epub 2018 Mar 28.
6
Biomass smoke from southern Africa can significantly enhance the brightness of stratocumulus over the southeastern Atlantic Ocean.来自南非的生物质烟雾可以显著提高东南大西洋层积云的亮度。
Proc Natl Acad Sci U S A. 2018 Mar 20;115(12):2924-2929. doi: 10.1073/pnas.1713703115. Epub 2018 Mar 5.
7
Recent intensification of winter haze in China linked to foreign emissions and meteorology.中国冬季雾霾加剧与外国排放物和气象有关。
Sci Rep. 2018 Feb 1;8(1):2107. doi: 10.1038/s41598-018-20437-7.
8
India Is Overtaking China as the World's Largest Emitter of Anthropogenic Sulfur Dioxide.印度正超过中国,成为全球人为二氧化硫的最大排放国。
Sci Rep. 2017 Nov 9;7(1):14304. doi: 10.1038/s41598-017-14639-8.
9
Dust-wind interactions can intensify aerosol pollution over eastern China.沙尘-风相互作用会加剧中国东部地区的气溶胶污染。
Nat Commun. 2017 May 11;8:15333. doi: 10.1038/ncomms15333.
10
Indonesian fire activity and smoke pollution in 2015 show persistent nonlinear sensitivity to El Niño-induced drought.2015年印度尼西亚的火灾活动和烟雾污染对厄尔尼诺引发的干旱表现出持续的非线性敏感性。
Proc Natl Acad Sci U S A. 2016 Aug 16;113(33):9204-9. doi: 10.1073/pnas.1524888113. Epub 2016 Aug 1.