SAMRC Developmental Pathways for Health Research Unit, University of the Witwatersrand, 27 St Andrew's Road, Parktown, Johannesburg 2193, South Africa.
Steno Diabetes Center Copenhagen, Gentofte, Denmark.
Bull World Health Organ. 2020 Dec 1;98(12):878-885I. doi: 10.2471/BLT.20.255703. Epub 2020 Sep 28.
To profile the prevalence of the three body mass index (BMI) categories by sociodemographic characteristics, and to calculate the percentage transitioning (or not) from one BMI category to another, to inform South African health policy for the control of obesity and noncommunicable diseases.
We used data from the National Income Dynamics Study, including sociodemographic characteristics and BMI measurements collected in 2008, 2010, 2012, 2014 and 2017. For each data collection wave and each population group, we calculated mean BMI and prevalence by category. We also calculated the percentage making an upwards transition (e.g. from overweight to obese), a downwards transition or remaining within a particular category. We used a multinomial logistic regression model to estimate transition likelihood.
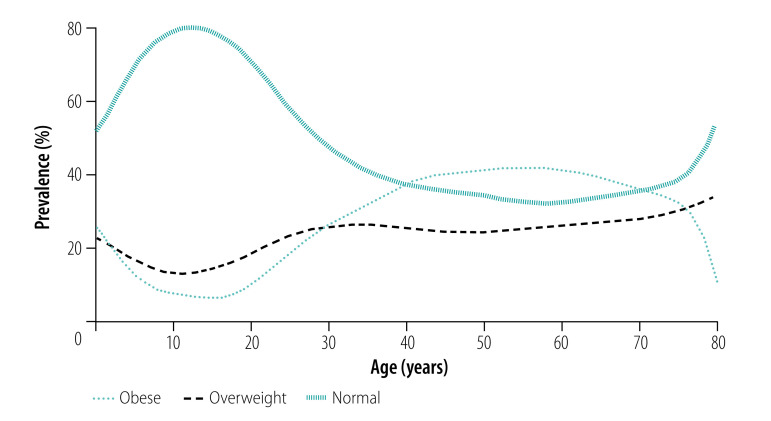
Between 2008 and 2017, mean BMI increased by 2.3 kg/m. We calculated an increased prevalence of obesity from 19.7% (3686/18 679) to 23.6% (3412/14 463), with the largest increases in prevalence for those aged 19-24 years and those with at least high school education. The percentages of upwards transitions to overweight or obese categories increased sharply between the ages of 19 and 50 years. Once overweight or obese, the likelihood of transitioning to a normal BMI is low, particularly for women, those of higher age groups, and those with a higher income and a higher level of education.
In the development of national strategies to control obesity and noncommunicable diseases, our results will allow limited public health resources to be focused on the relevant population groups.
描述社会人口特征与三种身体质量指数(BMI)类别之间的关系,并计算从一个 BMI 类别转变为另一个类别的百分比,为南非控制肥胖和非传染性疾病的卫生政策提供信息。
我们使用了来自国家收入动态研究的数据,包括 2008 年、2010 年、2012 年、2014 年和 2017 年收集的社会人口特征和 BMI 测量值。对于每一个数据收集波次和每一个人群组,我们计算了每个类别的平均 BMI 和患病率。我们还计算了向上转变(例如,从超重到肥胖)、向下转变或保持在特定类别的百分比。我们使用多变量逻辑回归模型来估计转变的可能性。
在 2008 年至 2017 年间,平均 BMI 增加了 2.3kg/m。我们计算出肥胖的患病率从 19.7%(3686/18679)增加到 23.6%(3412/14463),其中 19-24 岁和至少受过高中教育的人群患病率增加最大。19 至 50 岁之间,向超重或肥胖类别的向上转变百分比急剧增加。一旦超重或肥胖,向正常 BMI 转变的可能性很低,尤其是对于女性、年龄较大的人群、收入较高和教育水平较高的人群。
在制定国家肥胖和非传染性疾病控制战略时,我们的研究结果将使有限的公共卫生资源能够集中用于相关人群组。