Shanghai Jiao Tong University Affiliated Sixth People's Hospital, Shanghai, China.
Epidemiol Infect. 2021 Jan 5;149:e10. doi: 10.1017/S095026882000312X.
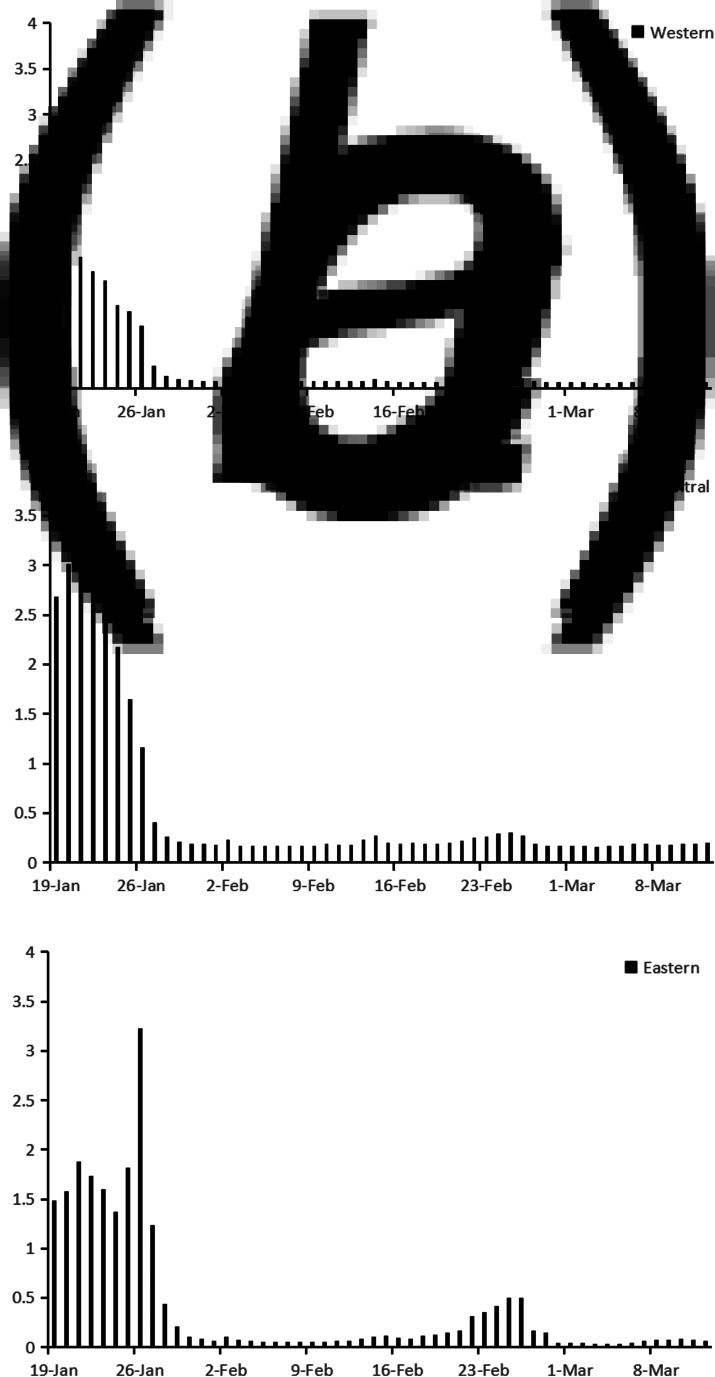
This study aims to locate the knots of cumulative coronavirus disease 2019 (COVID-19) case number during the first-level response to public health emergency in the provinces of China except Hubei. The provinces were grouped into three regions, namely eastern, central and western provinces, and the trends between adjacent knots were compared among the three regions. COVID-19 case number, migration scale index, Baidu index, demographic, economic and public health resource data were collected from 22 Chinese provinces from 19 January 2020 to 12 March 2020. Spline regression was applied to the data of all included, eastern, central and western provinces. The research period was divided into three stages by two knots. The first stage (from 19 January to around 25 January) was similar among three regions. However, in the second stage, growth of COVID-19 case number was flatter and lasted longer in western provinces (from 25 January to 18 February) than in eastern and central provinces (from 26 February to around 11 February). In the third stage, the growth of COVID-19 case number slowed down in all the three regions. Included covariates were different among the three regions. Overall, spline regression with covariates showed the different change patterns in eastern, central and western provinces, which provided a better insight into regional characteristics of COVID-19 pandemic.
本研究旨在定位中国除湖北省以外的省份在公共卫生应急一级响应期间累计新冠肺炎(COVID-19)病例数的节点。这些省份被分为东部、中部和西部三个地区,比较了三个地区相邻节点之间的趋势。从 2020 年 1 月 19 日至 3 月 12 日,收集了来自中国 22 个省份的 COVID-19 病例数、迁移规模指数、百度指数、人口、经济和公共卫生资源数据。对所有纳入的东部、中部和西部省份的数据应用样条回归。研究期间通过两个节点分为三个阶段。第一阶段(从 1 月 19 日至 1 月 25 日)在三个地区相似。然而,在第二阶段,西部省份(从 1 月 25 日至 2 月 18 日)的 COVID-19 病例数增长更为平缓且持续时间更长,而东部和中部省份(从 2 月 26 日至 2 月 11 日左右)则更快。在第三阶段,所有三个地区的 COVID-19 病例数增长均放缓。纳入的协变量在三个地区有所不同。总体而言,带有协变量的样条回归显示了东部、中部和西部省份不同的变化模式,为 COVID-19 大流行的区域特征提供了更好的认识。