Michigan Medicine, Ann Arbor, MI, USA.
Sci Rep. 2021 Jan 11;11(1):279. doi: 10.1038/s41598-020-79471-z.
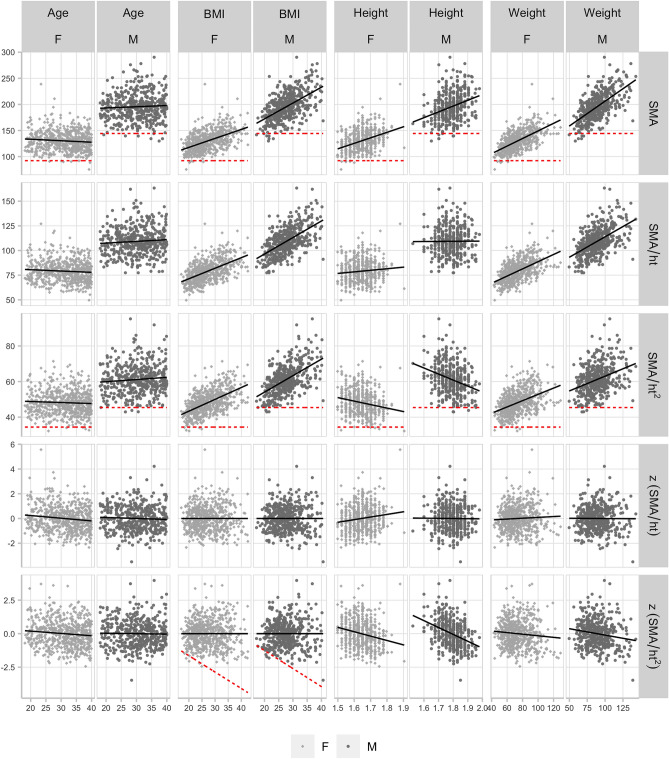
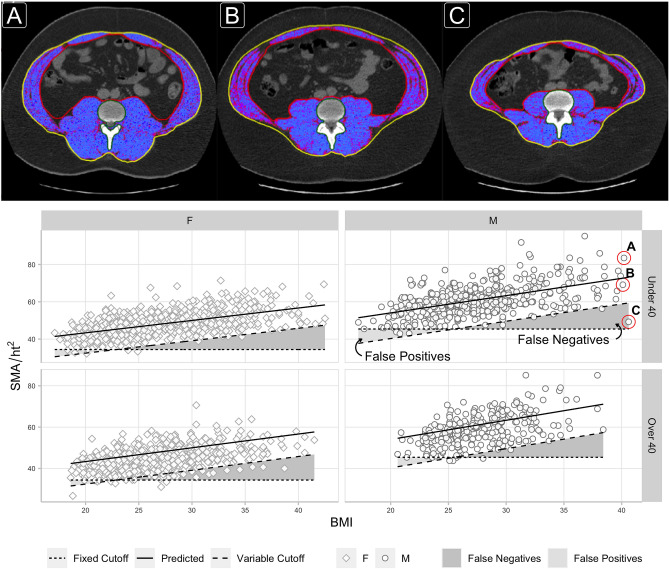
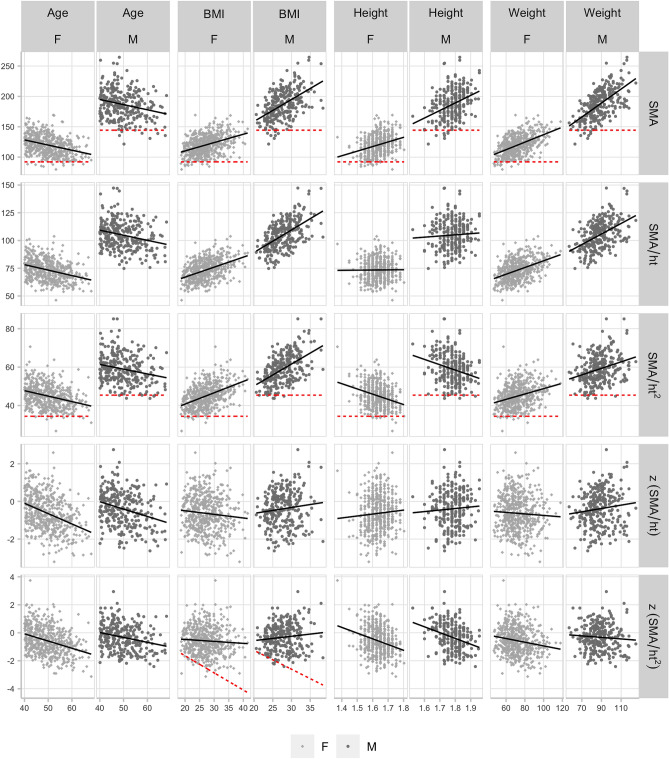
Measurements of skeletal muscle cross-sectional area (SMA) at the level of the third lumbar (L3) vertebra derived from clinical computed tomography (CT) scans are commonly used in assessments of sarcopenia, the loss of skeletal muscle mass and function associated with aging. As SMA is correlated with height and Body Mass Index (BMI), body size adjustment is necessary to fairly assess sarcopenic low muscle mass in individuals of different height and BMI. The skeletal muscle index, a widely used measure, adjusts for height as [Formula: see text] but uses no BMI adjustment. There is no agreed upon standard for body size adjustment. We extracted L3 SMA using non-contrast-enhanced CT scans from healthy adults, split into 'Under-40' and 'Over-40' cohorts. Sex-specific allometric analysis showed that height to the power of one was the optimal integer coefficient for height adjusted SMA in both males and females. We computed two height-adjusted measures [Formula: see text] and [Formula: see text], comparing their Pearson correlations versus age, height, weight, and BMI separately by sex and cohort. Finally, in the 'Under-40' cohort, we used linear regression to convert each height-adjusted measure into a z-score ([Formula: see text], [Formula: see text]) adjusted for BMI. [Formula: see text] was less correlated with height in both males and females ([Formula: see text], [Formula: see text] and [Formula: see text], [Formula: see text]) than [Formula: see text] ([Formula: see text] and [Formula: see text], [Formula: see text]). [Formula: see text] was uncorrelated with BMI and weight, and minimally correlated with height in males and females ([Formula: see text], [Formula: see text] and [Formula: see text], [Formula: see text]). The final [Formula: see text] equation was: [Formula: see text], where [Formula: see text], [Formula: see text], [Formula: see text], and sex = 1 if male, 0 if female. We propose [Formula: see text] for optimal height adjustment and the [Formula: see text] score for optimal height and BMI adjustment. By minimizing correlations with height and BMI, the [Formula: see text] score produces unbiased assessments of relative L3 skeletal muscle area across the full range of body sizes.
在评估与衰老相关的骨骼肌质量和功能损失的肌少症时,通常会使用临床计算机断层扫描(CT)扫描获得的第三腰椎(L3)水平的骨骼肌横截面积(SMA)测量值。由于 SMA 与身高和体重指数(BMI)相关,因此需要进行身体大小调整,以便公平评估不同身高和 BMI 的个体的肌少症低肌肉质量。骨骼肌指数是一种广泛使用的指标,它通过身高进行调整,即 [Formula: see text],但不进行 BMI 调整。目前还没有达成共识的身体大小调整标准。我们从健康成年人的非增强 CT 扫描中提取了 L3 SMA,并将其分为“40 岁以下”和“40 岁以上”两组。性别特异性比例分析表明,对于男性和女性,身高的整数系数为 1 时,是 SMA 身高调整的最佳整数系数。我们计算了两种身高调整指标 [Formula: see text] 和 [Formula: see text],并分别按性别和队列比较了它们与年龄、身高、体重和 BMI 的 Pearson 相关性。最后,在“40 岁以下”队列中,我们使用线性回归将每个身高调整指标转换为 BMI 调整的 z 分数([Formula: see text],[Formula: see text])。与身高相比,[Formula: see text] 在男性和女性中的相关性都较低([Formula: see text],[Formula: see text] 和 [Formula: see text],[Formula: see text]),而 [Formula: see text] ([Formula: see text] 和 [Formula: see text],[Formula: see text])。[Formula: see text] 与 BMI 和体重无关,与男性和女性的身高相关性最小([Formula: see text],[Formula: see text] 和 [Formula: see text],[Formula: see text])。最终的 [Formula: see text] 方程为:[Formula: see text],其中 [Formula: see text]、[Formula: see text]、[Formula: see text] 和性别=1 表示男性,0 表示女性。我们建议使用 [Formula: see text] 进行最佳身高调整,使用 [Formula: see text] 得分进行最佳身高和 BMI 调整。通过最小化与身高和 BMI 的相关性,[Formula: see text] 得分可在整个身体大小范围内对相对 L3 骨骼肌面积进行无偏评估。