• 文献检索
  • 文档翻译
  • 深度研究
  • 学术资讯
  • Suppr Zotero 插件Zotero 插件
  • 邀请有礼
  • 套餐&价格
  • 历史记录
应用&插件
Suppr Zotero 插件Zotero 插件浏览器插件Mac 客户端Windows 客户端微信小程序
定价
高级版会员购买积分包购买API积分包
服务
文献检索文档翻译深度研究API 文档MCP 服务
关于我们
关于 Suppr公司介绍联系我们用户协议隐私条款
关注我们

Suppr 超能文献

核心技术专利:CN118964589B侵权必究
粤ICP备2023148730 号-1Suppr @ 2026

文献检索

告别复杂PubMed语法,用中文像聊天一样搜索,搜遍4000万医学文献。AI智能推荐,让科研检索更轻松。

立即免费搜索

文件翻译

保留排版,准确专业,支持PDF/Word/PPT等文件格式,支持 12+语言互译。

免费翻译文档

深度研究

AI帮你快速写综述,25分钟生成高质量综述,智能提取关键信息,辅助科研写作。

立即免费体验

大都市特定年龄段死亡率的行政区和街区层面趋势:以墨西哥城为例。

Metropolitan age-specific mortality trends at borough and neighborhood level: The case of Mexico City.

机构信息

School of Medicine, Autonomous University of the State of Mexico, Toluca, State of Mexico, Mexico.

Computational Genomics Department, National Institute of Genomic Medicine, Mexico City, Mexico.

出版信息

PLoS One. 2021 Jan 19;16(1):e0244384. doi: 10.1371/journal.pone.0244384. eCollection 2021.

DOI:10.1371/journal.pone.0244384
PMID:33465102
原文链接:https://pmc.ncbi.nlm.nih.gov/articles/PMC7815139/
Abstract

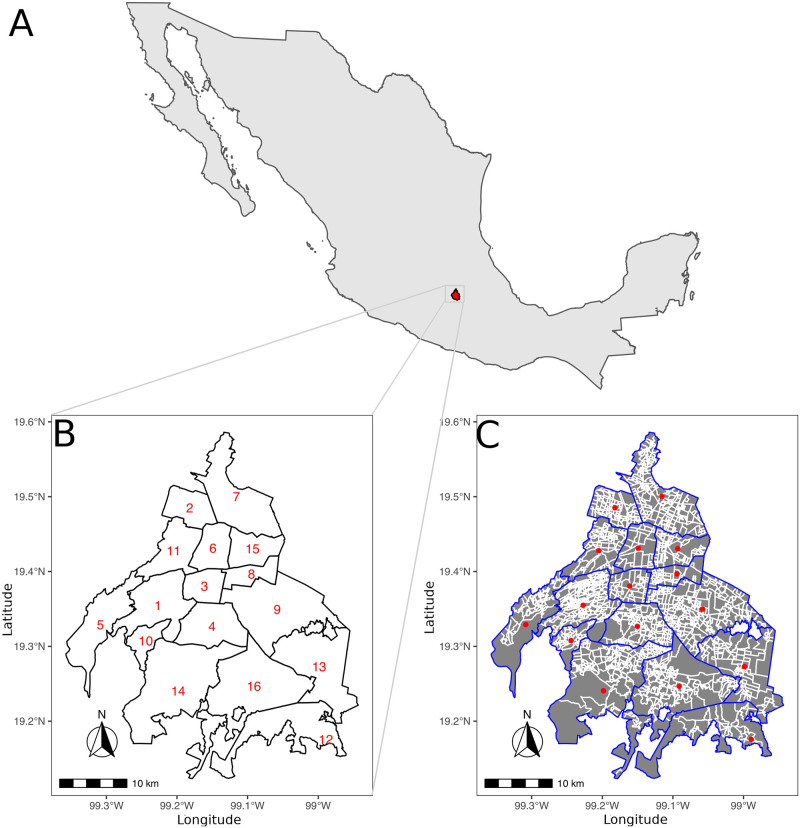
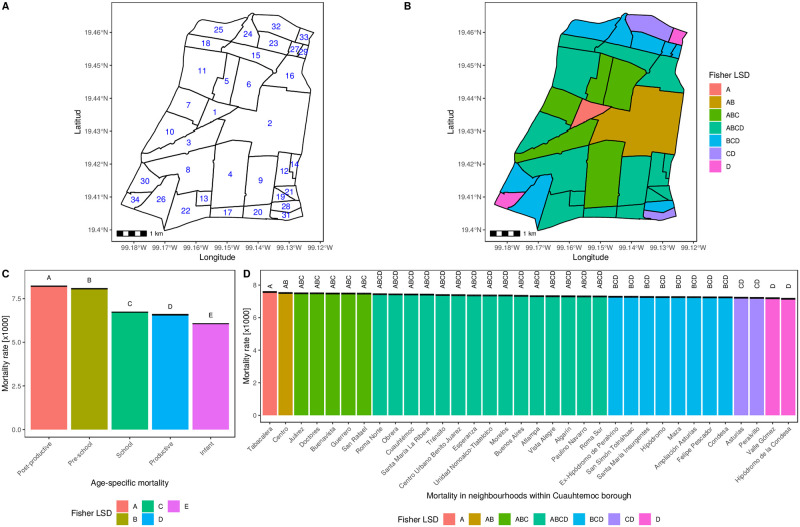
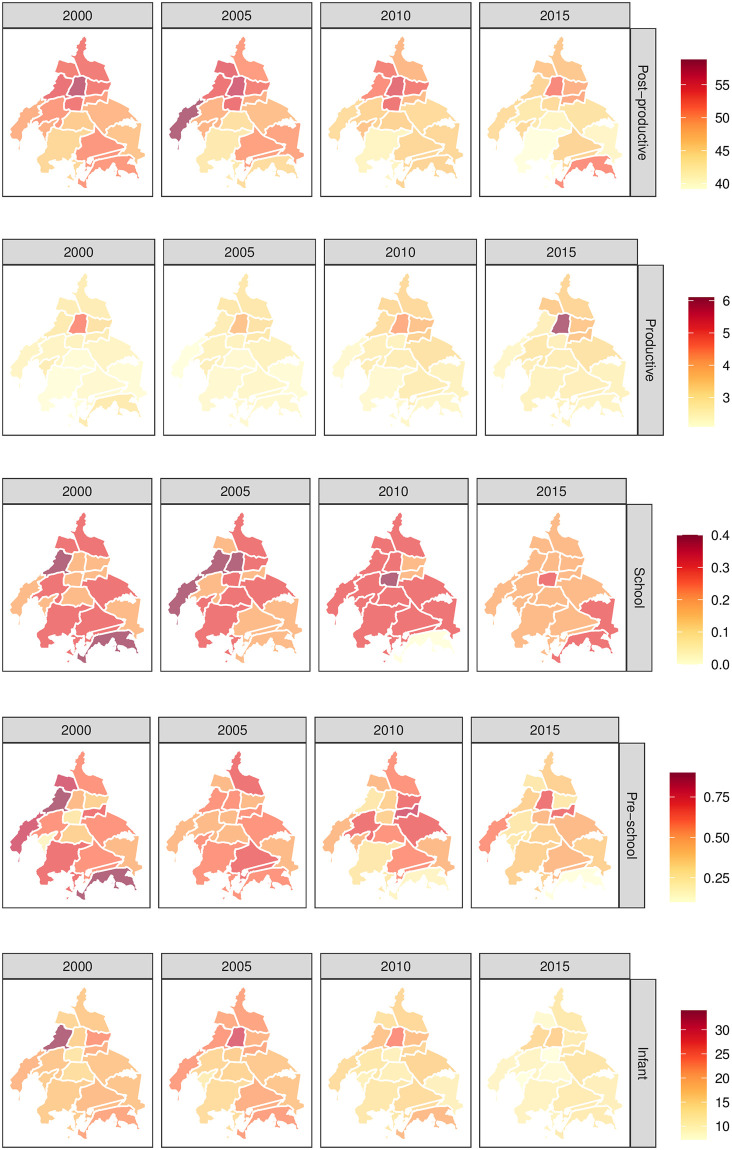
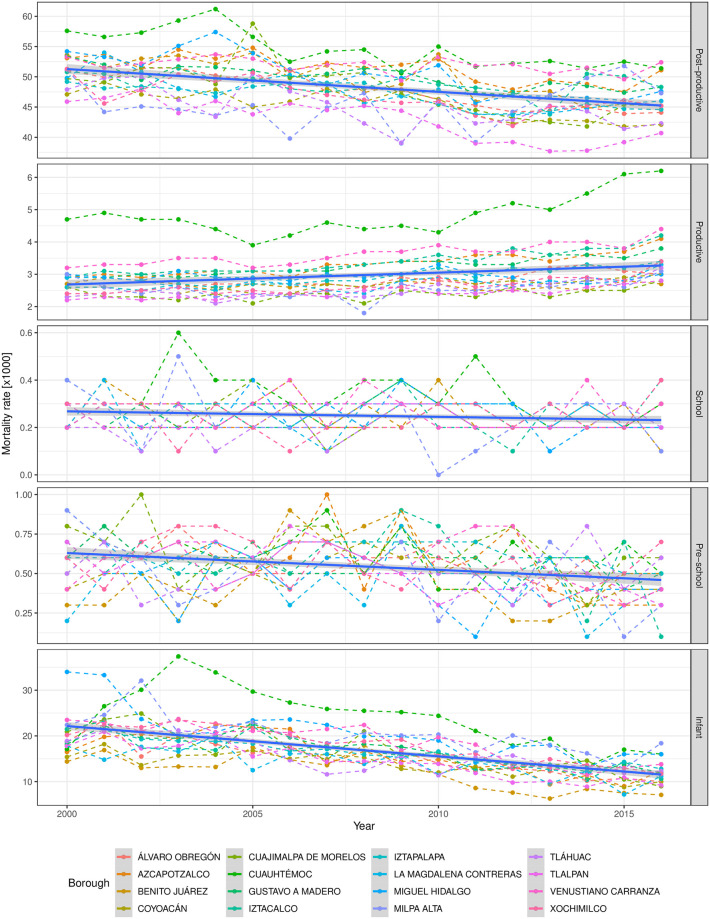
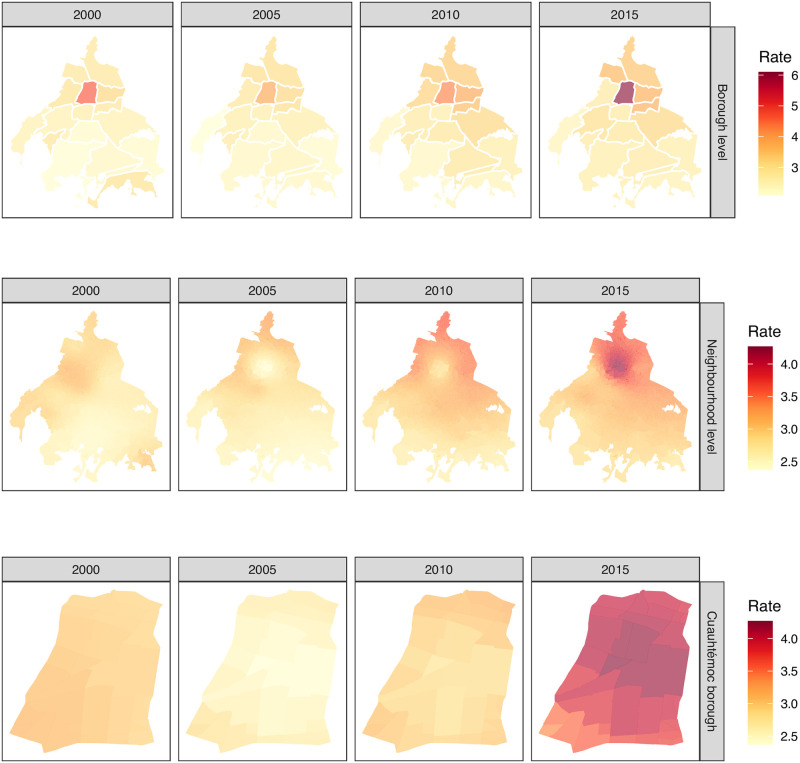
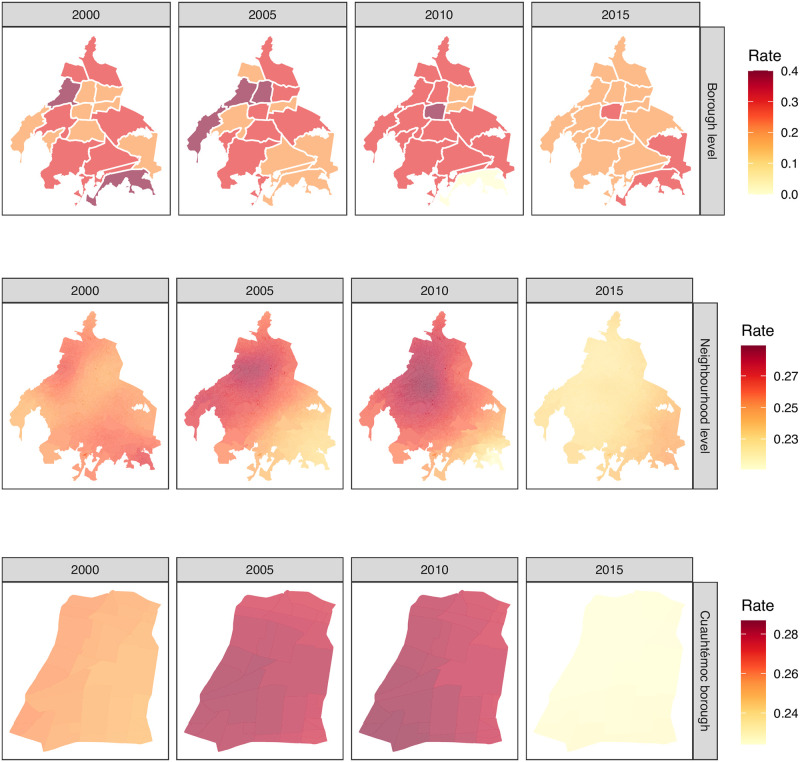
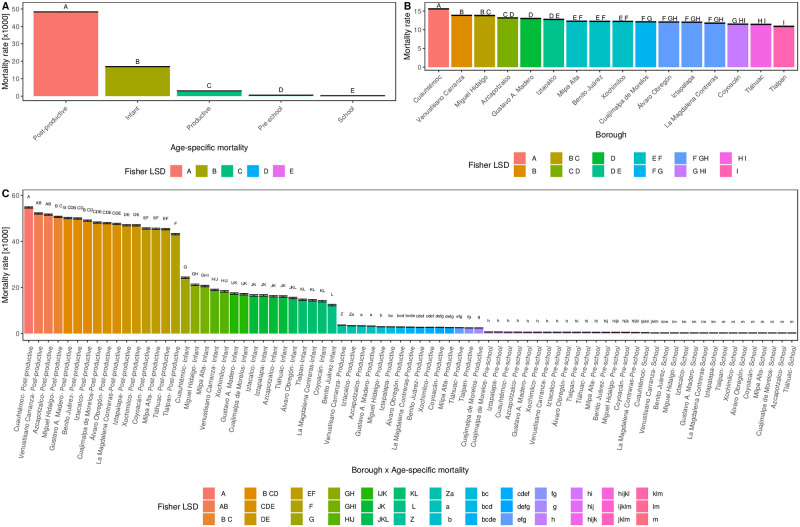
Understanding the spatial and temporal patterns of mortality rates in a highly heterogeneous metropolis, is a matter of public policy interest. In this context, there is no, to the best of our knowledge, previous studies that correlate both spatio-temporal and age-specific mortality rates in Mexico City. Spatio-temporal Kriging modeling was used over five age-specific mortality rates (from the years 2000 to 2016 in Mexico City), to gain both spatial (borough and neighborhood) and temporal (year and trimester) data level description. Mortality age-specific patterns have been modeled using multilevel modeling for longitudinal data. Posterior tests were carried out to compare mortality averages between geo-spatial locations. Mortality correlation extends in all study groups for as long as 12 years and as far as 13.27 km. The highest mortality rate takes place in the Cuauhtémoc borough, the commercial, touristic and cultural core downtown of Mexico City. On the contrary, Tlalpan borough is the one with the lowest mortality rates in all the study groups. Post-productive mortality is the first age-specific cause of death, followed by infant, productive, pre-school and scholar groups. The combinations of spatio-temporal Kriging estimation and time-evolution linear mixed-effect models, allowed us to unveil relevant time and location trends that may be useful for public policy planning in Mexico City.

摘要

了解高度异质大都市的死亡率的时空模式,是公共政策关注的问题。在这方面,据我们所知,以前没有研究将墨西哥城的时空和特定年龄死亡率相关联。本文使用时空克里金建模方法,对五个特定年龄死亡率(墨西哥城 2000 年至 2016 年)进行了研究,以获得空间(行政区和街区)和时间(年份和季度)数据水平描述。使用纵向数据分析的多层次建模对特定年龄死亡率模式进行了建模。进行了后验检验,以比较地理空间位置之间的死亡率平均值。死亡率相关性在所有研究组中都存在,最长可达 12 年,最远可达 13.27 公里。死亡率最高的行政区是科约特佩克行政区,即墨西哥城的商业、旅游和文化中心。相反,在所有研究组中,死亡率最低的行政区是特拉尔潘行政区。生育后死亡率是第一个特定年龄的死亡原因,其次是婴儿、生育期、学前和学生群体。时空克里金估计和时间演变线性混合效应模型的组合,使我们能够揭示可能对墨西哥城公共政策规划有用的相关时间和地点趋势。

https://cdn.ncbi.nlm.nih.gov/pmc/blobs/c37f/7815139/8f6269d0e086/pone.0244384.g007.jpg
https://cdn.ncbi.nlm.nih.gov/pmc/blobs/c37f/7815139/56c8df1f3d28/pone.0244384.g001.jpg
https://cdn.ncbi.nlm.nih.gov/pmc/blobs/c37f/7815139/0df5c7bf70b1/pone.0244384.g002.jpg
https://cdn.ncbi.nlm.nih.gov/pmc/blobs/c37f/7815139/7b5a3790b8e6/pone.0244384.g003.jpg
https://cdn.ncbi.nlm.nih.gov/pmc/blobs/c37f/7815139/e2a10315044d/pone.0244384.g004.jpg
https://cdn.ncbi.nlm.nih.gov/pmc/blobs/c37f/7815139/e121f0567a1e/pone.0244384.g005.jpg
https://cdn.ncbi.nlm.nih.gov/pmc/blobs/c37f/7815139/7113306494ce/pone.0244384.g006.jpg
https://cdn.ncbi.nlm.nih.gov/pmc/blobs/c37f/7815139/8f6269d0e086/pone.0244384.g007.jpg

相似文献

1
Metropolitan age-specific mortality trends at borough and neighborhood level: The case of Mexico City.大都市特定年龄段死亡率的行政区和街区层面趋势:以墨西哥城为例。
PLoS One. 2021 Jan 19;16(1):e0244384. doi: 10.1371/journal.pone.0244384. eCollection 2021.
2
Multicity study of air pollution and mortality in Latin America (the ESCALA study).拉丁美洲空气污染与死亡率的多城市研究(ESCALA研究)。
Res Rep Health Eff Inst. 2012 Oct(171):5-86.
3
[Meta-analysis of the Italian studies on short-term effects of air pollution].[意大利关于空气污染短期影响研究的荟萃分析]
Epidemiol Prev. 2001 Mar-Apr;25(2 Suppl):1-71.
4
The First exploratory spatial distribution analysis of tuberculosis and associated factors in Tonala, Mexico.墨西哥托纳拉的结核病及其相关因素的首次探索性空间分布分析。
J Infect Dev Ctries. 2020 Feb 29;14(2):207-213. doi: 10.3855/jidc.11873.
5
Vulnerability to heat-related mortality in Latin America: a case-crossover study in Sao Paulo, Brazil, Santiago, Chile and Mexico City, Mexico.拉丁美洲与高温相关的死亡易感性:在巴西圣保罗、智利圣地亚哥和墨西哥墨西哥城开展的病例交叉研究。
Int J Epidemiol. 2008 Aug;37(4):796-804. doi: 10.1093/ije/dyn094. Epub 2008 May 29.
6
Mapping child maltreatment risk: a 12-year spatio-temporal analysis of neighborhood influences.绘制儿童虐待风险图:12 年邻里影响的时空分析。
Int J Health Geogr. 2017 Oct 18;16(1):38. doi: 10.1186/s12942-017-0111-y.
7
Modelling local patterns of child mortality risk: a Bayesian Spatio-temporal analysis.儿童死亡风险的局部模式建模:贝叶斯时空分析
BMC Public Health. 2021 Jan 6;21(1):29. doi: 10.1186/s12889-020-10016-9.
8
Mortality trends and risk of dying from colorectal cancer in the seven socioeconomic regions of Mexico, 2000-2012.2000 - 2012年墨西哥七个社会经济区域的死亡率趋势及死于结直肠癌的风险
Rev Gastroenterol Mex. 2017 Jul-Sep;82(3):217-225. doi: 10.1016/j.rgmx.2016.10.005. Epub 2017 Mar 18.
9
Analysis of fatal pedestrian injuries in Mexico City, 1994-1997.1994 - 1997年墨西哥城行人致命伤害情况分析
Injury. 2001 May;32(4):279-84. doi: 10.1016/s0020-1383(00)00220-5.
10
Multi-scalar influences on mortality change over time in 274 European cities.274个欧洲城市中多尺度因素对死亡率随时间变化的影响。
Soc Sci Med. 2017 Apr;179:45-51. doi: 10.1016/j.socscimed.2017.02.034. Epub 2017 Feb 24.

引用本文的文献

1
Persistently high incidence rates of childhood acute leukemias from 2010 to 2017 in Mexico City: A population study from the MIGICCL.2010 年至 2017 年墨西哥城儿童急性白血病发病率持续居高不下:来自 MIGICCL 的一项人群研究。
Front Public Health. 2022 Sep 14;10:918921. doi: 10.3389/fpubh.2022.918921. eCollection 2022.
2
Spatio-Temporal Representativeness of Air Quality Monitoring Stations in Mexico City: Implications for Public Health.墨西哥城空气质量监测站的时空代表性:对公共健康的影响。
Front Public Health. 2021 Jan 12;8:536174. doi: 10.3389/fpubh.2020.536174. eCollection 2020.

本文引用的文献

1
Lung Cancer Mortality in China: Spatial and Temporal Trends Among Subpopulations.中国肺癌死亡率:亚人群的时空趋势。
Chest. 2019 Nov;156(5):972-983. doi: 10.1016/j.chest.2019.07.023. Epub 2019 Aug 14.
2
Preventable Mortality in Regions of Slovakia-Quantification of Regional Disparities and Investigation of the Impact of Environmental Factors.斯洛伐克地区可预防的死亡率——区域差异的量化和环境因素影响的调查。
Int J Environ Res Public Health. 2019 Apr 17;16(8):1382. doi: 10.3390/ijerph16081382.
3
No Man is an Island: The Impact of Neighborhood Disadvantage on Mortality.
无人是孤岛:邻里劣势对死亡率的影响。
Int J Environ Res Public Health. 2019 Apr 9;16(7):1265. doi: 10.3390/ijerph16071265.
4
Post-pandemic influenza-associated mortality in Mexico.墨西哥大流感后相关死亡率。
Pathog Glob Health. 2019 Mar;113(2):67-74. doi: 10.1080/20477724.2019.1589211. Epub 2019 Mar 21.
5
Epidemiology of Pancreatic Cancer: Global Trends, Etiology and Risk Factors.胰腺癌的流行病学:全球趋势、病因及风险因素
World J Oncol. 2019 Feb;10(1):10-27. doi: 10.14740/wjon1166. Epub 2019 Feb 26.
6
Trends in mortality inequalities in an urban area: the influence of immigration.城市地区死亡率不平等趋势:移民的影响。
Int J Equity Health. 2019 Feb 26;18(1):37. doi: 10.1186/s12939-019-0939-9.
7
Upsurge of Homicides and Its Impact on Life Expectancy and Life Span Inequality in Mexico, 2005-2015.墨西哥 2005-2015 年凶杀案激增及其对预期寿命和寿命不平等的影响。
Am J Public Health. 2019 Mar;109(3):483-489. doi: 10.2105/AJPH.2018.304878. Epub 2019 Jan 24.
8
Global, regional, and national age-sex-specific mortality for 282 causes of death in 195 countries and territories, 1980-2017: a systematic analysis for the Global Burden of Disease Study 2017.全球、区域和国家按年龄、性别和死因分类的死亡率,195 个国家和地区,1980-2017 年:2017 年全球疾病负担研究的系统分析。
Lancet. 2018 Nov 10;392(10159):1736-1788. doi: 10.1016/S0140-6736(18)32203-7. Epub 2018 Nov 8.
9
Before the here and now: What we can learn from variation in spatiotemporal patterns of changing heart disease mortality by age group, time period, and birth cohort.在此时此地之前:我们可以从不同年龄组、时间段和出生队列中心血管病死亡率时空变化模式的差异中学到什么。
Soc Sci Med. 2018 Nov;217:97-105. doi: 10.1016/j.socscimed.2018.09.045. Epub 2018 Sep 25.
10
All-Cause and Cancer Mortality Trends in Macheng, China (1984⁻2013): An Age-Period-Cohort Analysis.中国麻城全死因和癌症死亡率趋势(1984-2013):基于年龄-时期-队列分析。
Int J Environ Res Public Health. 2018 Sep 20;15(10):2068. doi: 10.3390/ijerph15102068.