Cardiovascular Diabetology Research Group, Division of Endocrinology and Diabetology, Department of Internal Medicine, Medical University of Graz, 8036 Graz, Austria.
Division of Exercise Physiology and Metabolism, Department of Sport Science, University of Bayreuth, 95445 Bayreuth, Germany.
Biosensors (Basel). 2021 Jan 15;11(1):22. doi: 10.3390/bios11010022.
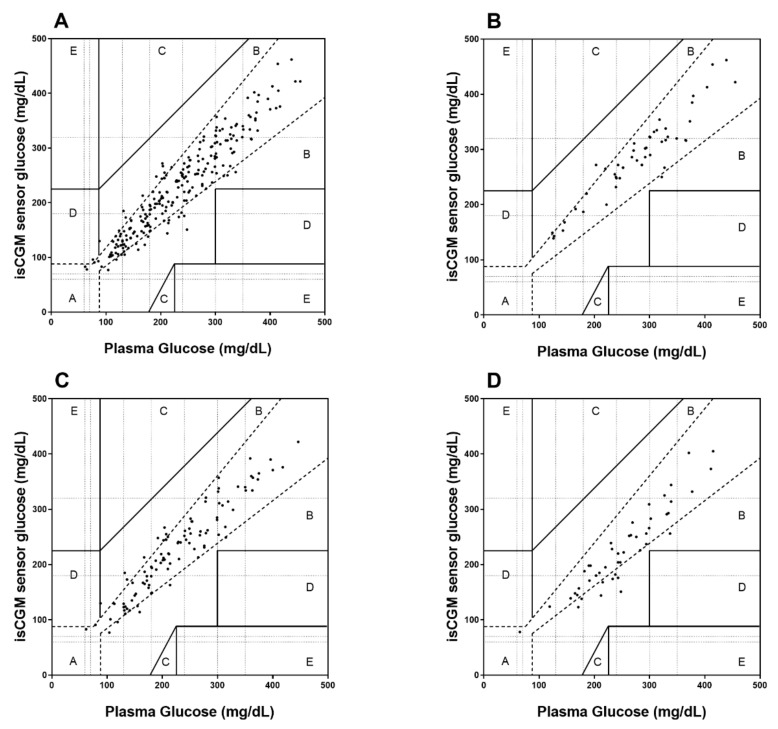
To assess intermittently scanned continuous glucose monitoring (isCGM) performance for different rates of change in plasma glucose (RCPG) during glycemic challenges in type 1 diabetes (T1D). Nineteen people with T1D (7 females; age 35 ± 11 years; HbA 7.3 ± 0.6% (56 ± 7 mmol/mol)) performing two glycemic challenges (OGTT) were included. During OGTTs, plasma glucose was compared against sensor glucose for timepoints 0 min (pre-OGTT), +15 min, +30 min, +60 min, +120 min, +180 min, and +240 min by means of median absolute (relative) difference (MARD and MAD) and Clarke Error Grid (CEG), then was stratified for RCPG and glycemic ranges. Overall, MARD was 8.3% (4.0-14.8) during hypoglycemia level 1 18.8% (15.8-22.0), euglycemia 9.5% (4.3-15.1), hyperglycemia level 1 9.4% (4.0-17.2), and hyperglycemia level 2 7.1% (3.3-11.9). The MARD was associated with the RCPG ( < 0.0001), detailing significant differences in comparison of low, moderate, high, and very high RCPG ( = 0.014). Overall, CEG resulted in 88% (212 values) of comparison points in zone A, 12% (29 values) in zone B, and 0.4% (1 value) in zone D. The isCGM system was accurate during OGTTs. Its performance was dependent on the RCPG and showed an overestimation of the actual reference glucose during hypoglycemia.
评估 1 型糖尿病(T1D)患者血糖挑战期间不同血糖变化率(RCPG)时间歇性扫描连续血糖监测(isCGM)的性能。纳入 19 名 T1D 患者(7 名女性;年龄 35 ± 11 岁;HbA1c7.3 ± 0.6%(56 ± 7 mmol/mol))进行了两项血糖挑战(OGTT)。在 OGTT 期间,通过中位数绝对(相对)差值(MARD 和 MAD)和 Clarke 误差网格(CEG),将血浆葡萄糖与传感器葡萄糖进行比较,时间点为 0 分钟(OGTT 前)、+15 分钟、+30 分钟、+60 分钟、+120 分钟、+180 分钟和+240 分钟,然后根据 RCPG 和血糖范围进行分层。总体而言,低血糖 1 级时 MARD 为 8.3%(4.0-14.8),18.8%(15.8-22.0);血糖正常时 9.5%(4.3-15.1);高血糖 1 级时 9.4%(4.0-17.2);高血糖 2 级时 7.1%(3.3-11.9)。MARD 与 RCPG 相关(<0.0001),详细比较了低、中、高和非常高 RCPG 的差异(=0.014)。总体而言,CEG 结果 88%(212 个值)的比较点在 A 区,12%(29 个值)在 B 区,0.4%(1 个值)在 D 区。isCGM 系统在 OGTT 期间准确。其性能取决于 RCPG,并且在低血糖期间会高估实际参考葡萄糖。