Abrams Zachary B, Coombes Caitlin E, Li Suli, Coombes Kevin R
Department of Biomedical Informatics, The Ohio State University, Columbus, OH 43210, USA.
College of Medicine, The Ohio State University, Columbus, OH 43210, USA.
Bioinformatics. 2021 Sep 9;37(17):2780-2781. doi: 10.1093/bioinformatics/btab037.
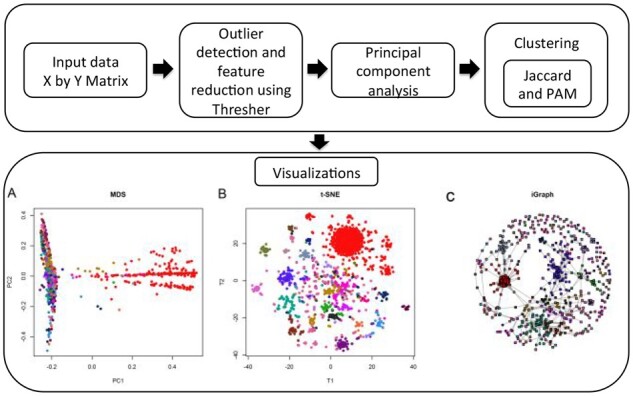
Unsupervised machine learning provides tools for researchers to uncover latent patterns in large-scale data, based on calculated distances between observations. Methods to visualize high-dimensional data based on these distances can elucidate subtypes and interactions within multi-dimensional and high-throughput data. However, researchers can select from a vast number of distance metrics and visualizations, each with their own strengths and weaknesses. The Mercator R package facilitates selection of a biologically meaningful distance from 10 metrics, together appropriate for binary, categorical and continuous data, and visualization with 5 standard and high-dimensional graphics tools. Mercator provides a user-friendly pipeline for informaticians or biologists to perform unsupervised analyses, from exploratory pattern recognition to production of publication-quality graphics.
Mercator is freely available at the Comprehensive R Archive Network (https://cran.r-project.org/web/packages/Mercator/index.html).
无监督机器学习为研究人员提供了工具,使其能够基于观测值之间的计算距离,在大规模数据中发现潜在模式。基于这些距离对高维数据进行可视化的方法,可以阐明多维和高通量数据中的亚型及相互作用。然而,研究人员可以从大量距离度量和可视化方法中进行选择,每种方法都有其优缺点。Mercator R包有助于从10种度量中选择具有生物学意义的距离,这些度量共同适用于二元、分类和连续数据,并可使用5种标准和高维图形工具进行可视化。Mercator为信息学家或生物学家提供了一个用户友好的管道,用于执行无监督分析,从探索性模式识别到生成可用于发表的高质量图形。
Mercator可在综合R存档网络(https://cran.r-project.org/web/packages/Mercator/index.html)上免费获取。